This guide will look at working with GDB to step into or over a function in our code.
Basic GDB Usage
To illustrate this, you can use your code or use the sample provided below. In the example below, the loop me function contains a loop that we will examine with GDB.
Compile the code with -g as:
Next, launch the program with GDB as:
Once in GDB, we can run the program by using the run or r command. You can stop the program while it's running by using the CTRL + C key.
Let us set a breakpoint at the main function to halt the execution at that point. In the example above, we halt at line 10.
Breakpoint 1 at 0x555555555171: file loop.c, line 10.
To step through your program line by line, you can use the next or n command.
$ (gdb) n

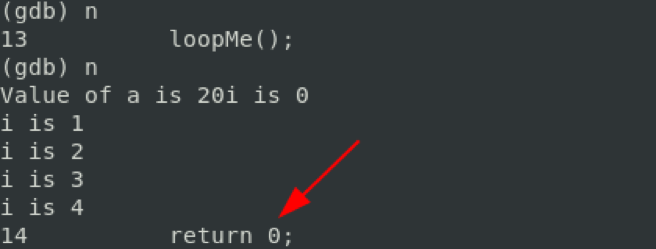
Once you get to the function you want to work on, in the example above, the loopMe() function, you can step over it using the next command.
This will skip function and go directly return 0 as:

You can also step into the function and work on it using the step or s command. For example, to enter the loopMe() function, we can do:
The command will step into the function as:

Now that we are inside the loopMe() function, we can go through it line by line using the next command:

As you can see, we run through the loop and see how the loop executes.
Conclusion
In this quick tutorial, we discussed the process of using GDB to step over or into a function when debugging.
from Linux Hint https://ift.tt/3xTi4Rm


0 Comments