


Prometheus can generate alerts when a target is unavailable and send them to the Alert Manager, sending you an email notification to let you know that a target is down. This is just an example. Prometheus can send alerts to Alert Manager depending on any Prometheus metrics. So, the possibilities are limitless.
In this article, I will show you how to install Prometheus Alert Manager on Ubuntu 20.04 LTS. I will also show you how to configure Prometheus and Alert Manager to send you email notifications via Gmail when a Prometheus target is down (unavailable). So, let’s get started.
Table of Contents:
- Prerequisites
- Installing Alert Manager
- Creating a Data Directory
- Starting Alert Manager on Boot
- Configuring Prometheus
- Creating a Prometheus Alert Rule
- Configuring Gmail Receiver on Alert Manager
- Troubleshooting Alert Manager E-Mail Delivery Issues
- Conclusion
- References
Prerequisites:
To follow this article, you must:
- Create a prometheus system user.
- Have Prometheus installed on your computer.
This article is a continuation of the article How to Install Prometheus on Ubuntu 20.04 LTS. If you need any assistance on installing Prometheus on Ubuntu 20.04 LTS and creating a prometheus system user, be sure to check it out.
Installing Alert Manager:
You can download the latest version of Alert Manager from the official website of Prometheus and install it on Ubuntu 20.04 LTS very easily.
First, navigate to the ~/Downloads directory (or any other temporary directory of your choice) as follows:
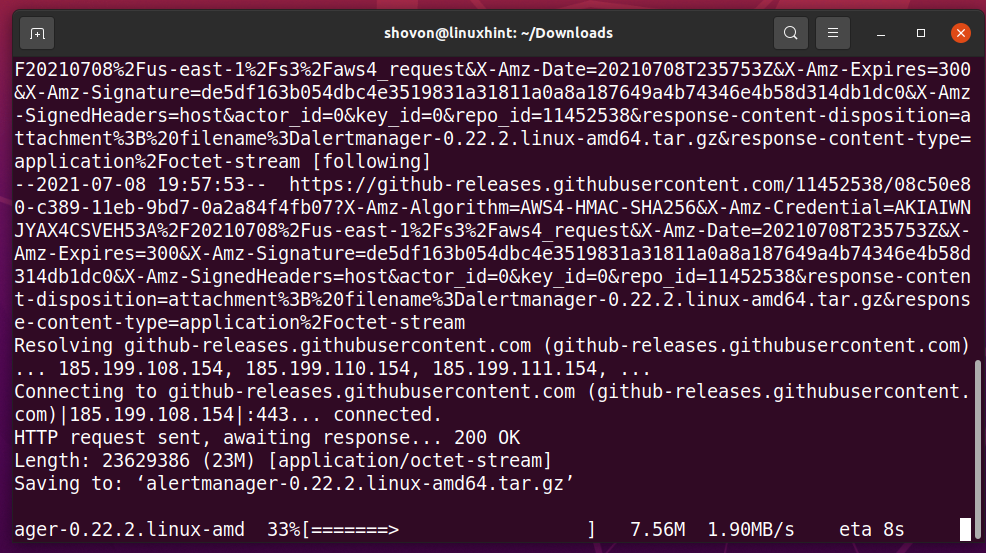
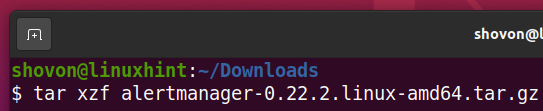
Download the latest version of Alert Manager (v0.22.2 at the time of this writing) with the following command:

Alert Manager is being downloaded. It may take a while to complete.
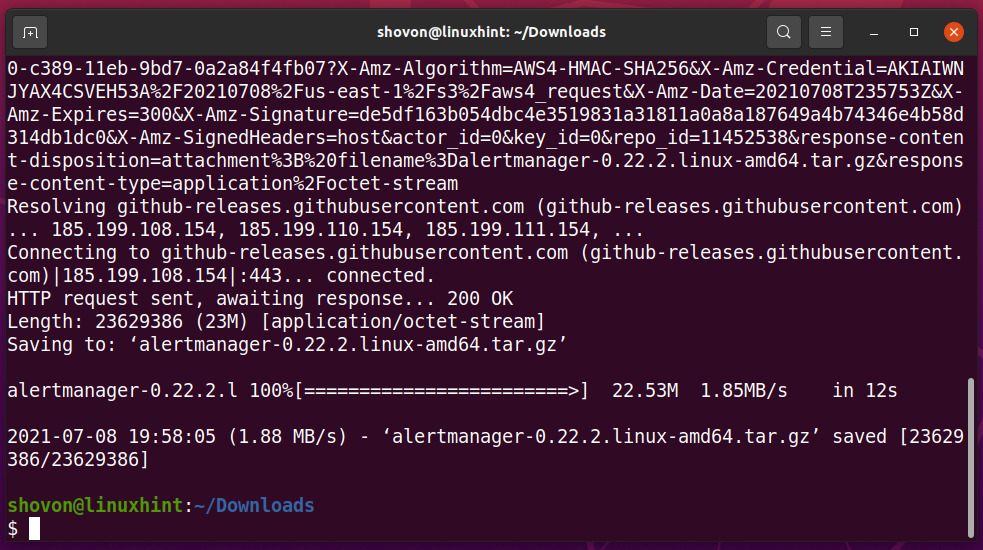
At this point, Alert Manager should be downloaded.
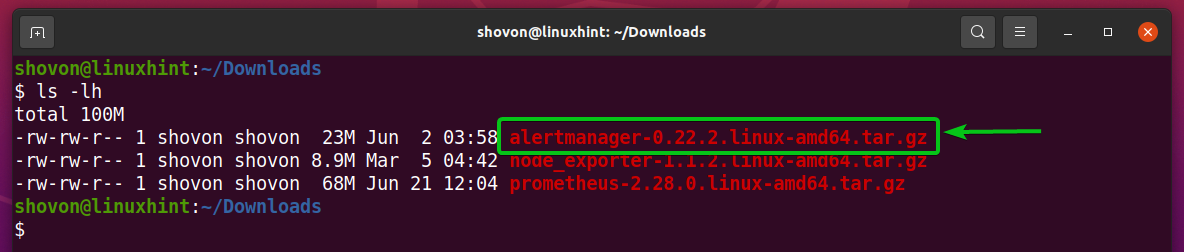
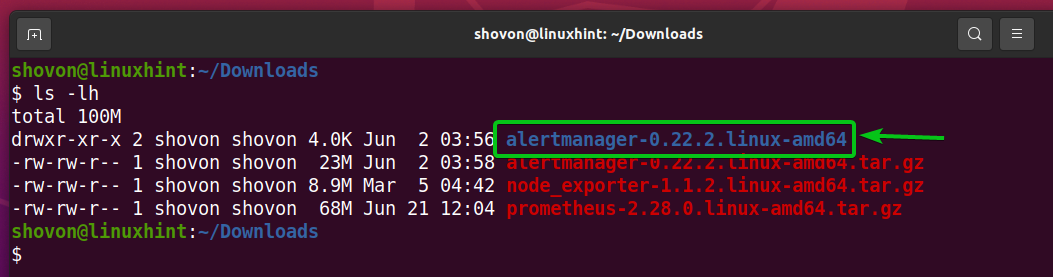
Once Alert Manager is downloaded, you should find a new archive file alertmanager-0.22.2.linux-amd64.tar.gz in your current working directory, as marked in the screenshot below.
Extract the alertmanager-0.22.2.linux-amd64.tar.gz archive with the following command:
You should find a new directory alertmanager-0.22.2.linux-amd64/ as marked in the screenshot below.
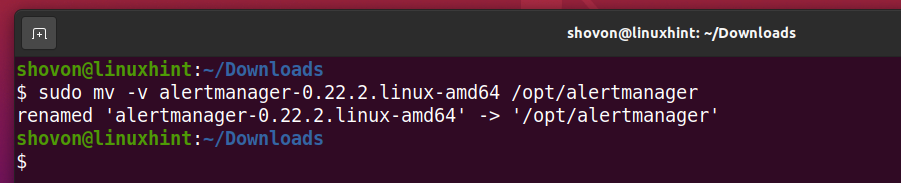
Now, move the alertmanager-0.22.2.linux-amd64 directory to /opt/ directory and rename it to alertmanager as follows:
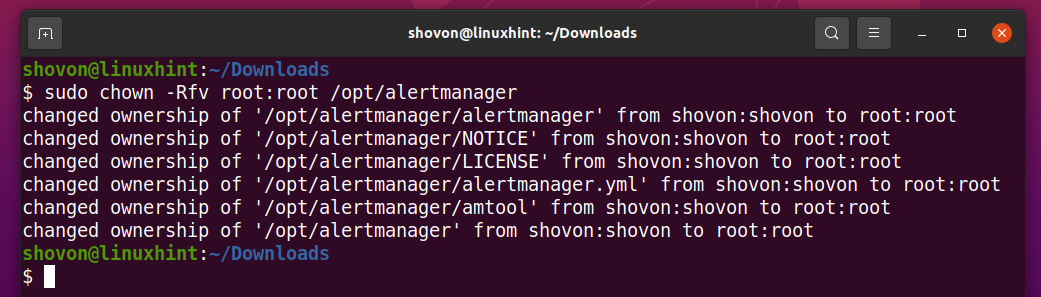
Change the user and group of all the files and directories of the /opt/alertmanager/ directory to root as follows:
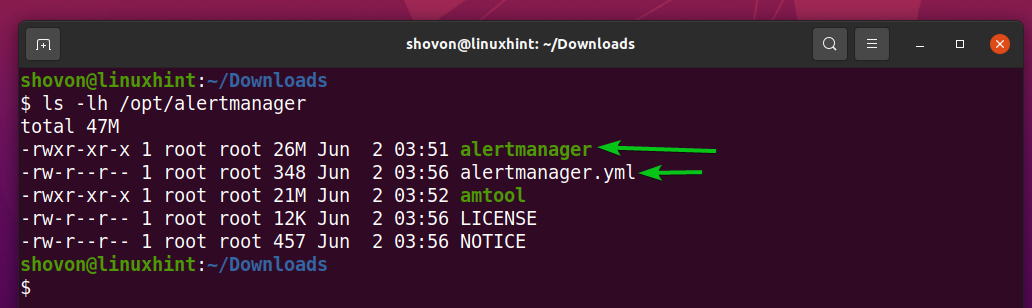
In the /opt/alertmanager directory, you should find the alertmanager binary and the Alert Manager configuration file alertmanager.yml, as marked in the screenshot below. You will use them later. So, just keep that in mind.
Creating a Data Directory:
Alert Manager needs a directory where it can store its data. As you will be running Alert Manager as the prometheus system user, the prometheus system user must have access (read, write, and execute permissions) to that data directory.
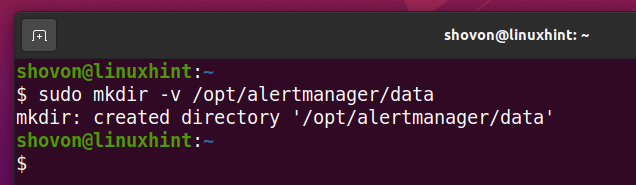
You can create the data/ directory in the /opt/alertmanager/ directory as follows:
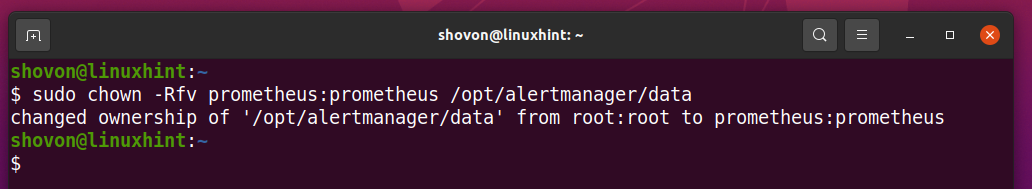
Change the owner and group of the /opt/alertmanager/data/ directory to prometheus with the following command:
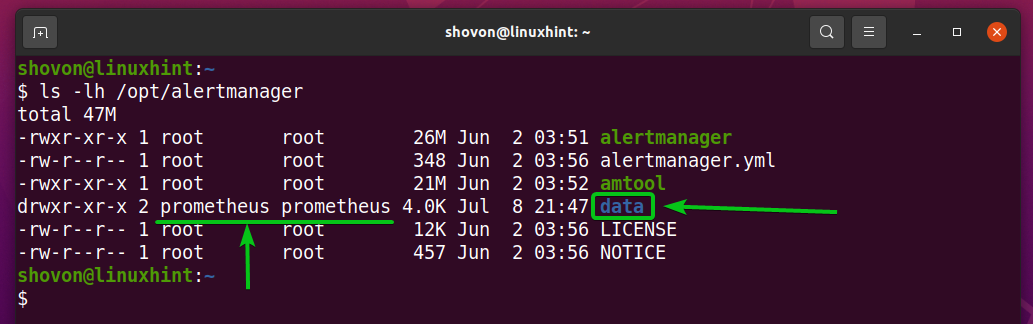
The owner and group of the /opt/alertmanager/data/ directory should be changed to prometheus, as shown in the screenshot below.
Starting Alert Manager on Boot:
Now, you have to create a systemd service file for Alert Manager so that you can easily manage (start, stop, restart, and add to startup) the alertmanager service with systemd.
To create a systemd service file alertmanager.service, run the following command:
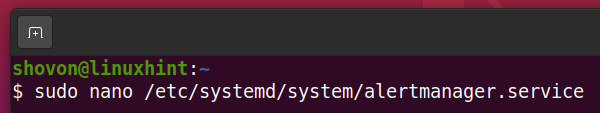
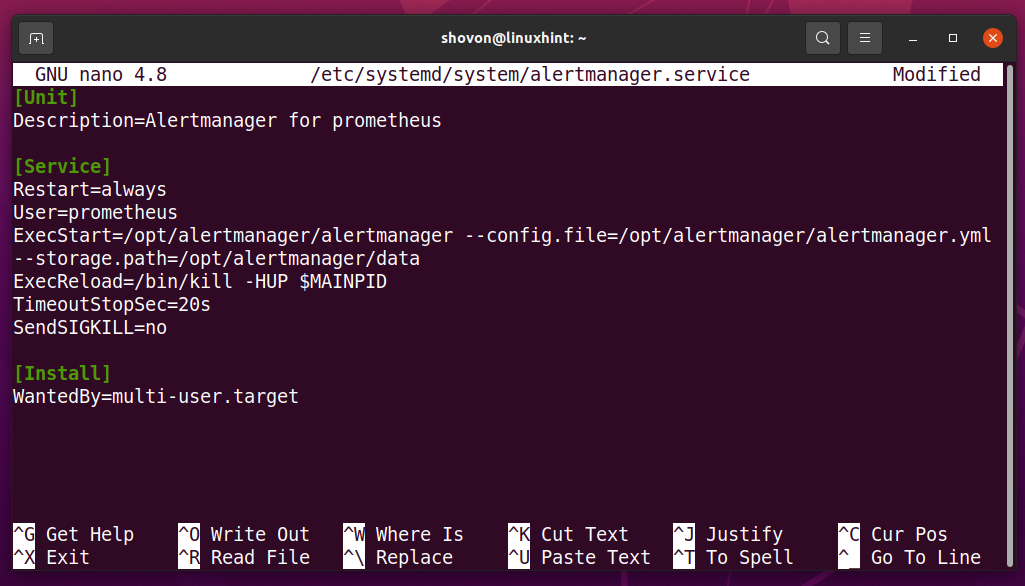
Type in the following lines in the alertmanager.service file.
Description=Alertmanager for prometheus
[Service]
Restart=always
User=prometheus
ExecStart=/opt/alertmanager/alertmanager --config.file=/opt/alertmanager/alertmanager.yml --storage.path=/opt/alertmanager/data
ExecReload=/bin/kill -HUP $MAINPID
TimeoutStopSec=20s
SendSIGKILL=no
[Install]
WantedBy=multi-user.target
Once you’re done, press <Ctrl> + X followed by Y and <Enter> to save the alertmanager.service file.
For the systemd changes to take effect, run the following command:
Now, start the alertmanager service with the following command:
Add the alertmanager service to the system startup so that it automatically starts on boot with the following command:
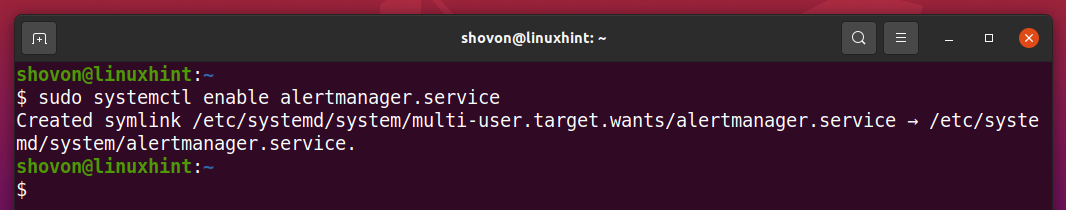
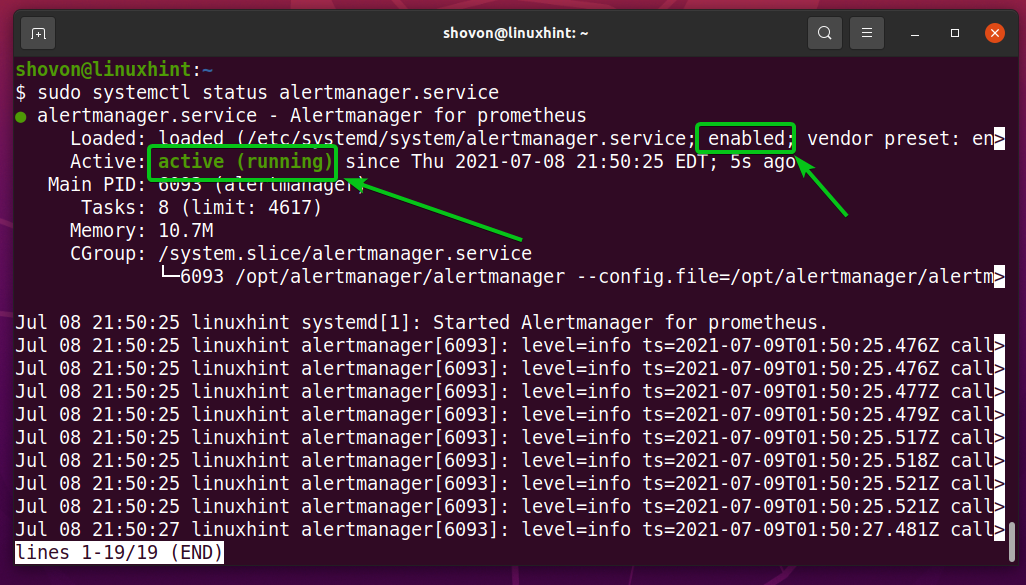
As you can see, the alertmanager service is active/running. It is also enabled (it will start automatically on boot).
Configuring Prometheus:
Now, you have to configure Prometheus to use Alert Manager. You can also monitor Alert Manager with Prometheus. I will show you how to do both in this section.
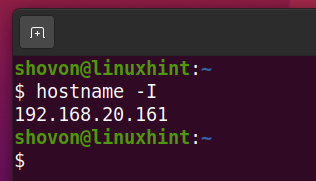
First, find the IP address of the computer where you have installed Alert Manager with the following command:
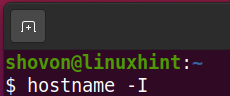
In my case, the IP address is 192.168.20.161. It will be different for you. So, make sure to replace it with yours from now on.
Now, open the Prometheus configuration file /opt/prometheus/prometheus.yml with the nano text editor as follows:

Type in the following lines in the scrape_configs section to add Alert Manager for monitoring with Prometheus.
static_configs:
- targets: ['192.168.20.161:9093']
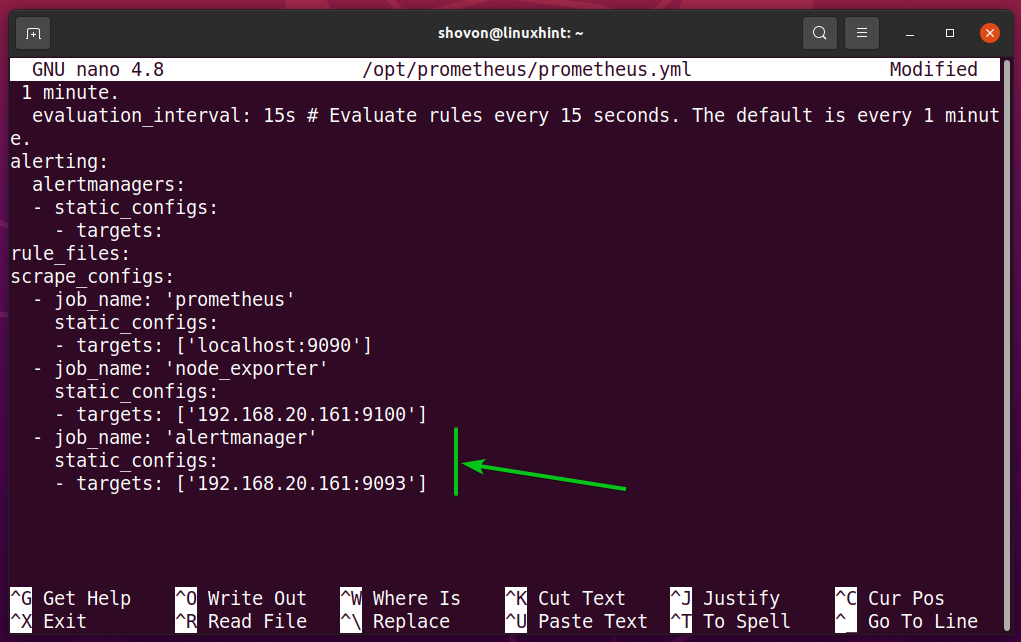
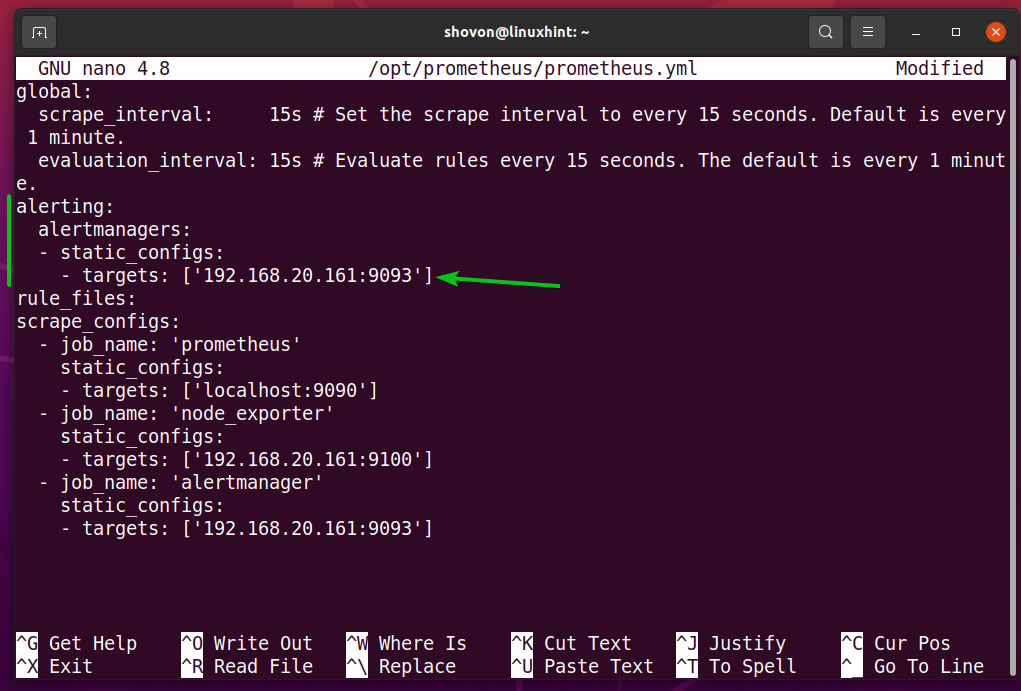
Also, type in the IP address and port number of Alert Manager in the alerting > alertmanagers section as marked in the screenshot below.
Once you’re done, press <Ctrl> + X followed by Y and <Enter> to save the prometheus.yml configuration file.
For the changes to take effect, restart the prometheus service as follows:
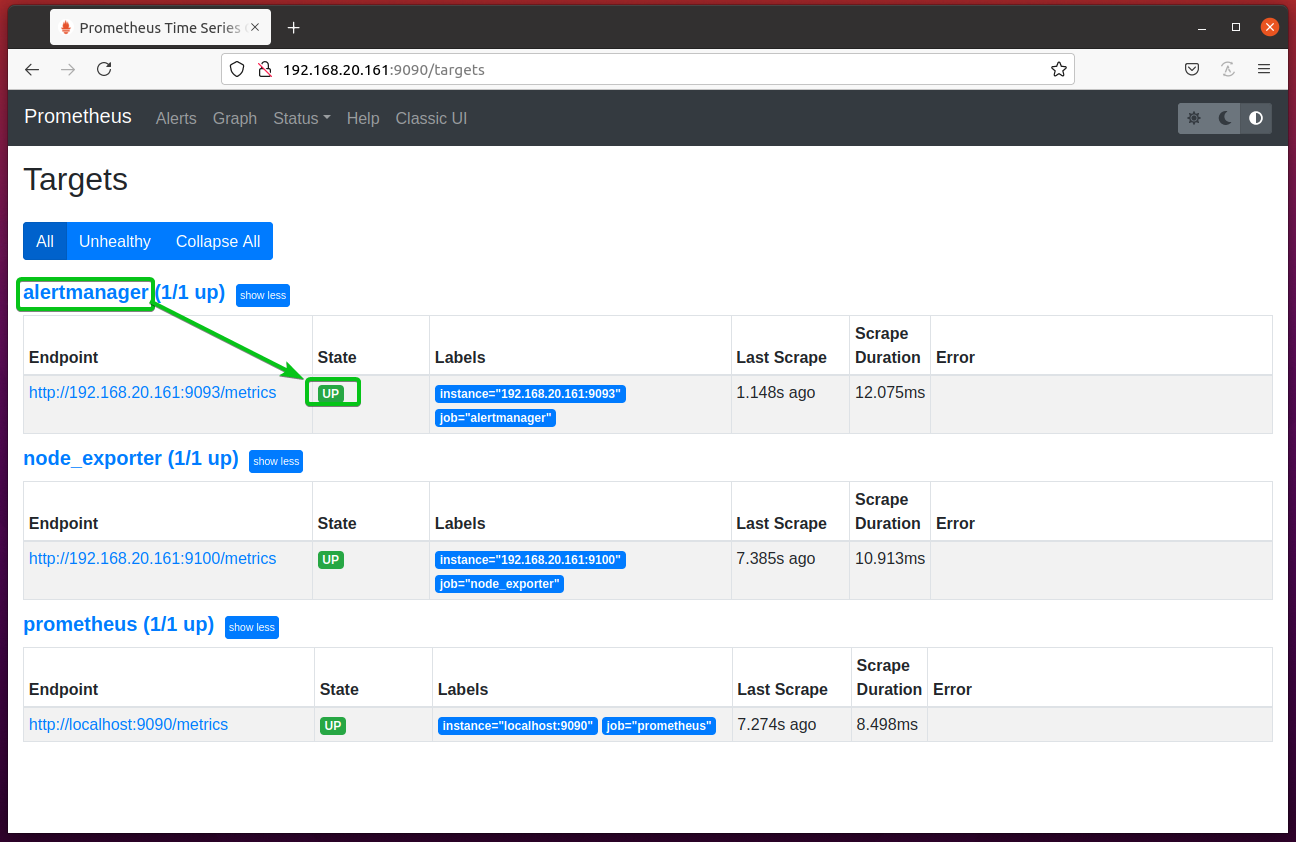
Visit the URL http://192.168.20.161:9090/targets from your favorite web browser, and you should see that alertmanager is in the UP state. So, Prometheus can access Alert Manager just fine.
NOTE: I have installed Prometheus and Alert Manager on the same computer. So, the IP address of my Prometheus instance is the same as Alert Managers. If you have installed Prometheus on a different computer, make the necessary adjustments from now on.
Creating a Prometheus Alert Rule:
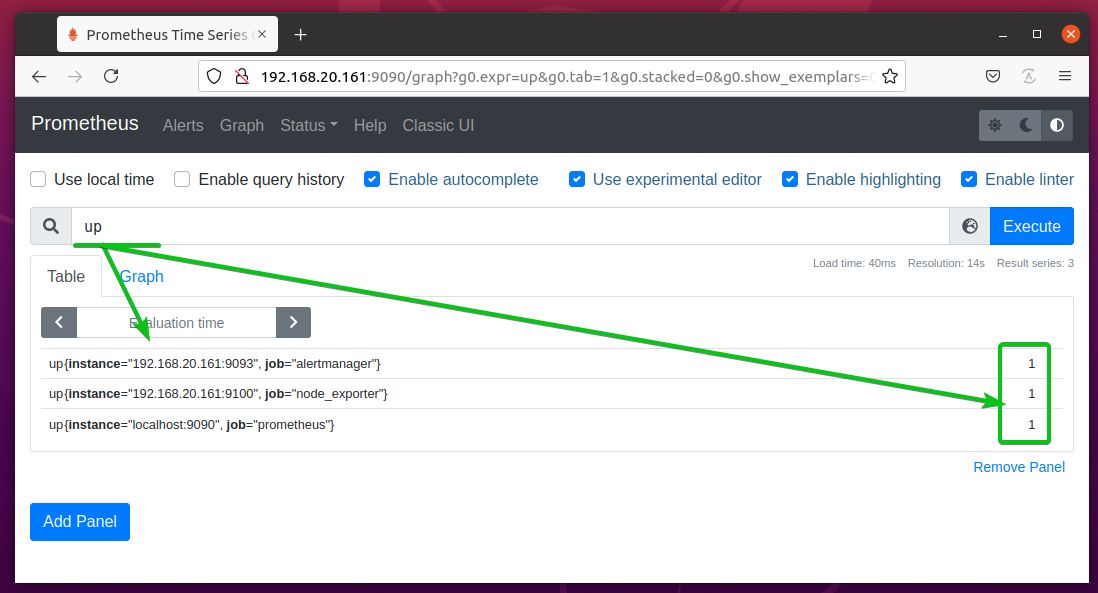
On Prometheus, you can use the up expression to find the state of the targets added to Prometheus, as shown in the screenshot below.
The targets that are in the UP state (running and accessible to Prometheus) will have the value 1, and targets that are not in the UP (or DOWN) state (not running or inaccessible to Prometheus) will have the value 0.
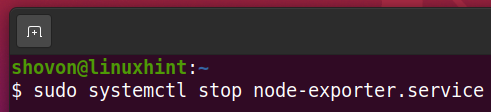
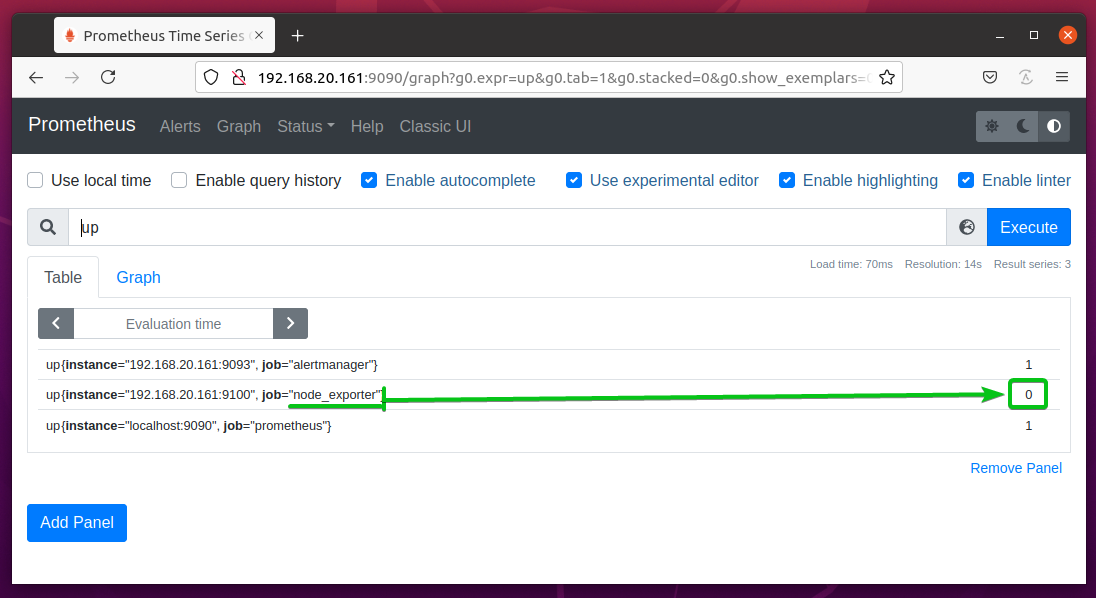
If you stop one of the targets – node_exporter (let’s say).
The up value of that target should be 0, as you can see in the screenshot below. You get the idea.
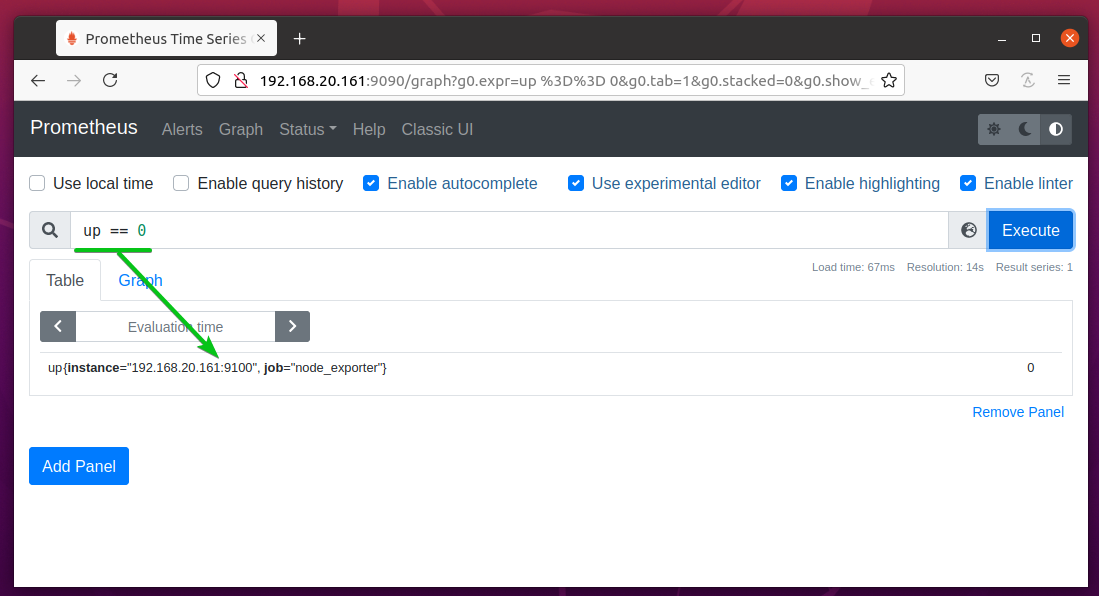
So, you can use the up == 0 expressions to list only the targets that are not running or inaccessible to Prometheus, as you can see in the screenshot below.
This expression can be used to create a Prometheus Alert and send alerts to Alert Manager when one or more targets are not running or inaccessible to Prometheus.
To create a Prometheus Alert, create a new file rules.yml in the /opt/prometheus/ directory as follows:
Now, type in the following lines in the rules.yml file.
- name: test
rules:
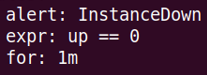
- alert: InstanceDown
expr: up == 0
for: 1m
Once you’re done, press + X followed by Y and <Enter> to save the rules.yml file.
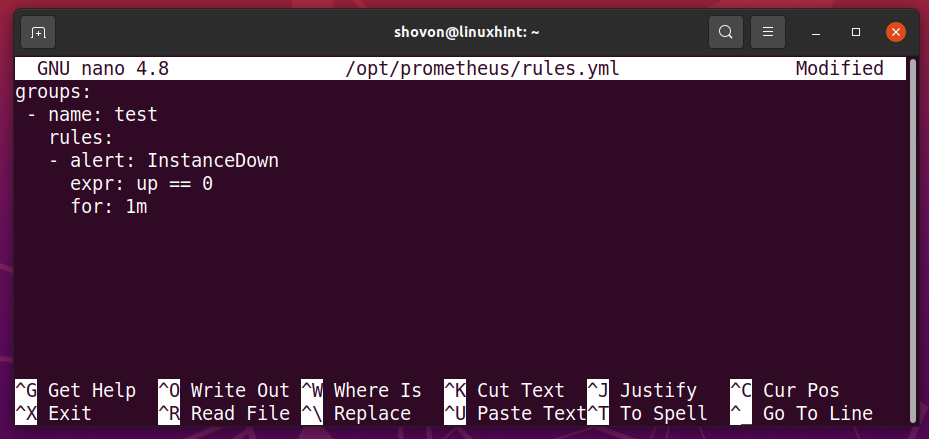
Here, the alert InstanceDown will be fired when targets are not running or inaccessible to Prometheus (that is up == 0) for a minute (1m).
Now, open the Prometheus configuration file /opt/prometheus/prometheus.yml with the nano text editor as follows:
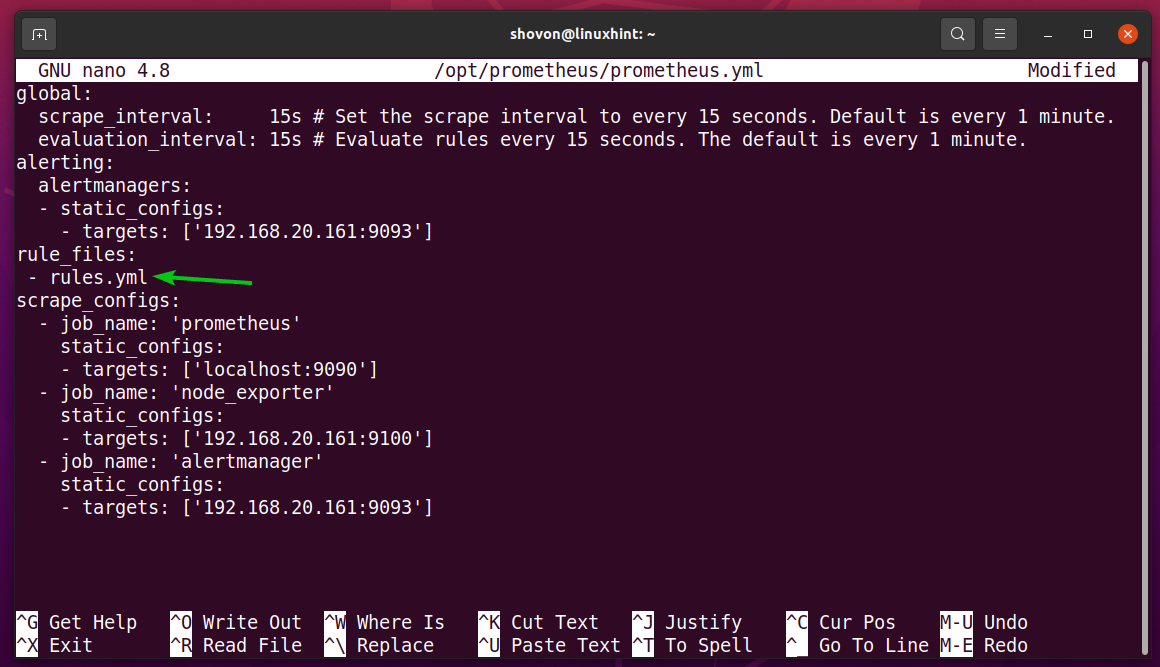
Add the rules.yml file in the rule_files section of the prometheus.yml configuration file as marked in the screenshot below.
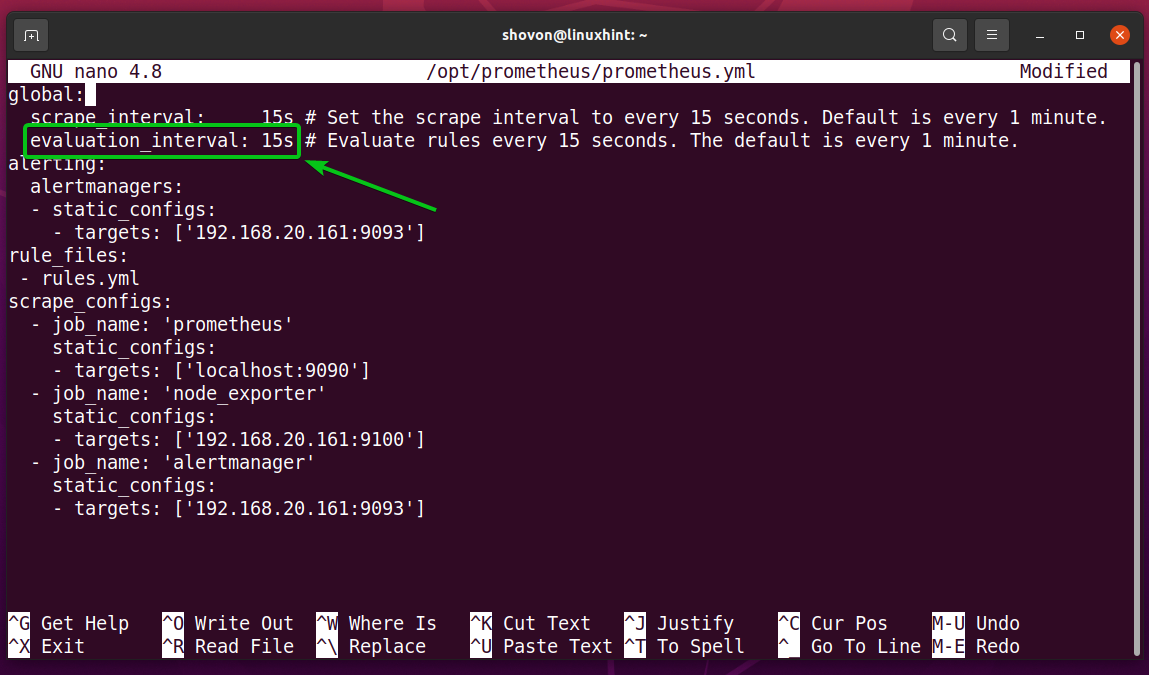
Another important option of the prometheus.yml file is evaluation_interval. Prometheus will check whether any rules matched every evaluation_interval time. The default is 15s (15 seconds). So, the Alert rules in the rules.yml file will be checked every 15 seconds.
Once you’re done, press <Ctrl> + X followed by Y and <Enter> to save the prometheus.yml file.
For the changes to take effect, restart the prometheus service as follows:
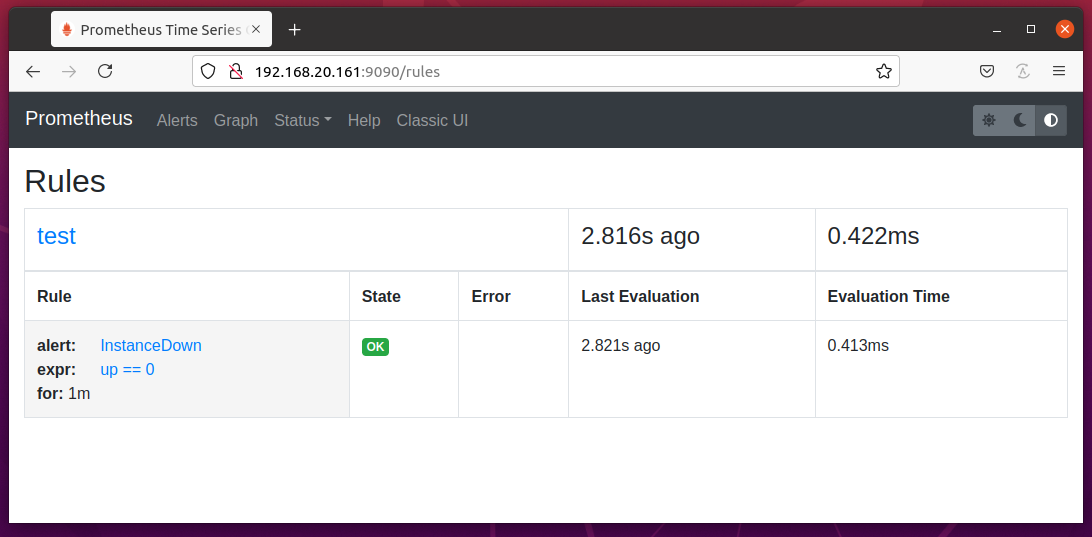
Now, navigate to the URL http://192.168.20.161:9090/rules from your favorite web browser, and you should see the rule InstanceDown that you’ve just added.
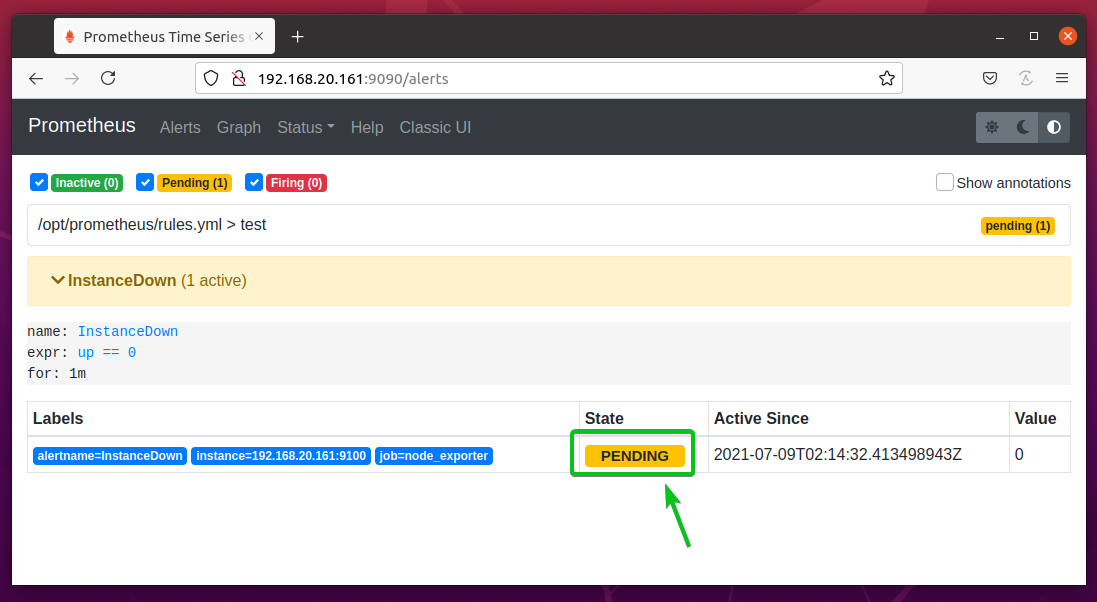
Navigate to the URL http://192.168.20.161:9090/alerts from your favorite web browser, and you should see the state of the alert InstanceDown, as you can see in the screenshot below.
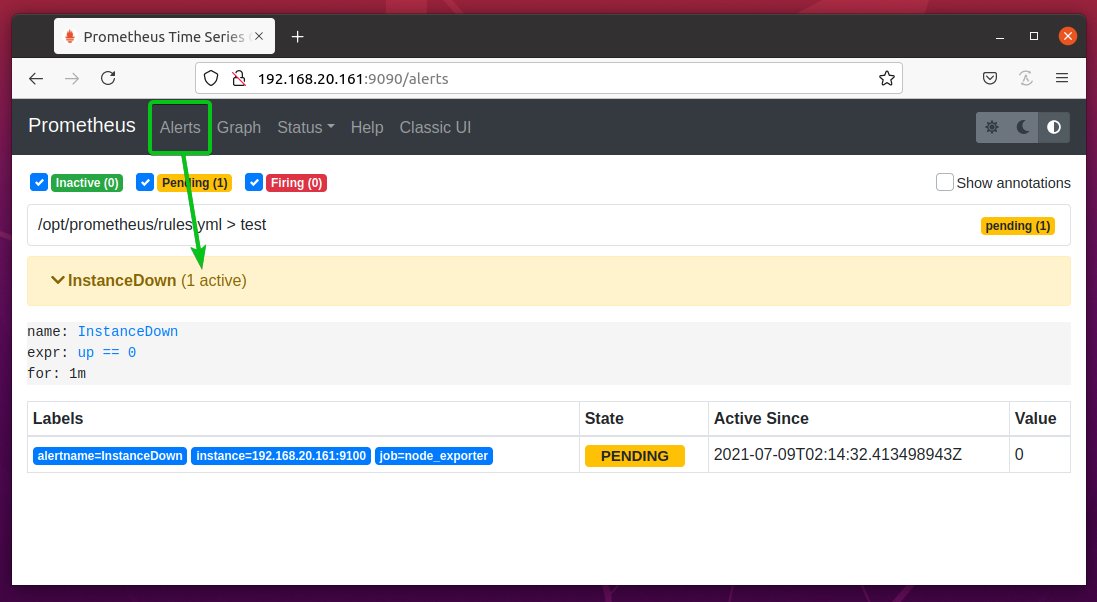
As you’ve stopped node_exporter earlier, the alert is active, and it is waiting to be sent to the Alert Manager.
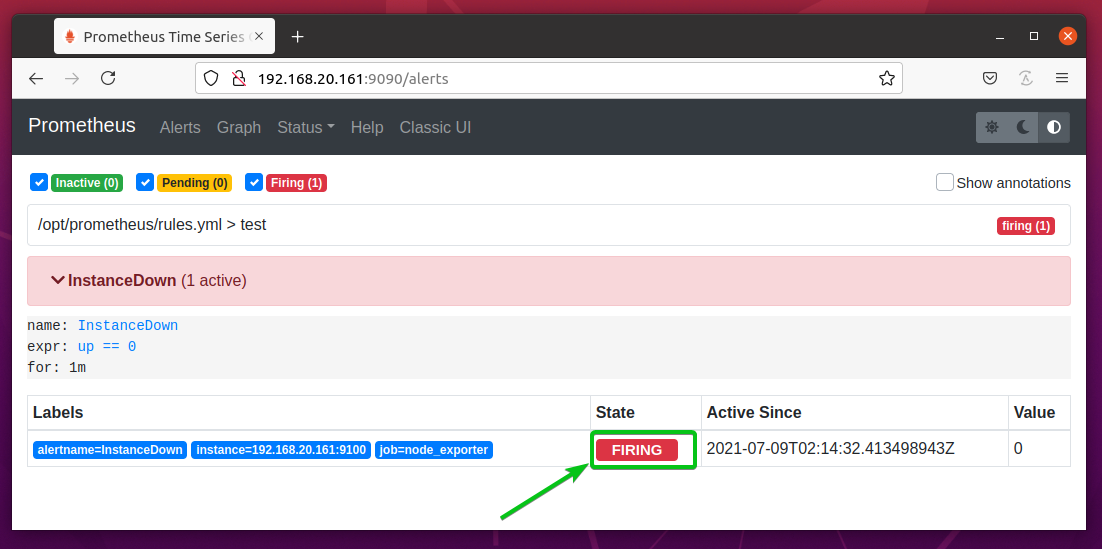
After a minute has passed, the alert InstanceDown should be in the FIRING state. It means that the alert is sent to the Alert Manager.
Configuring Gmail Receiver on Alert Manager:
In this section, I will show you how to configure Gmail as the Alert Manager receiver so that you can get emails on your Gmail account from Alert Manager if a Prometheus target is DOWN.
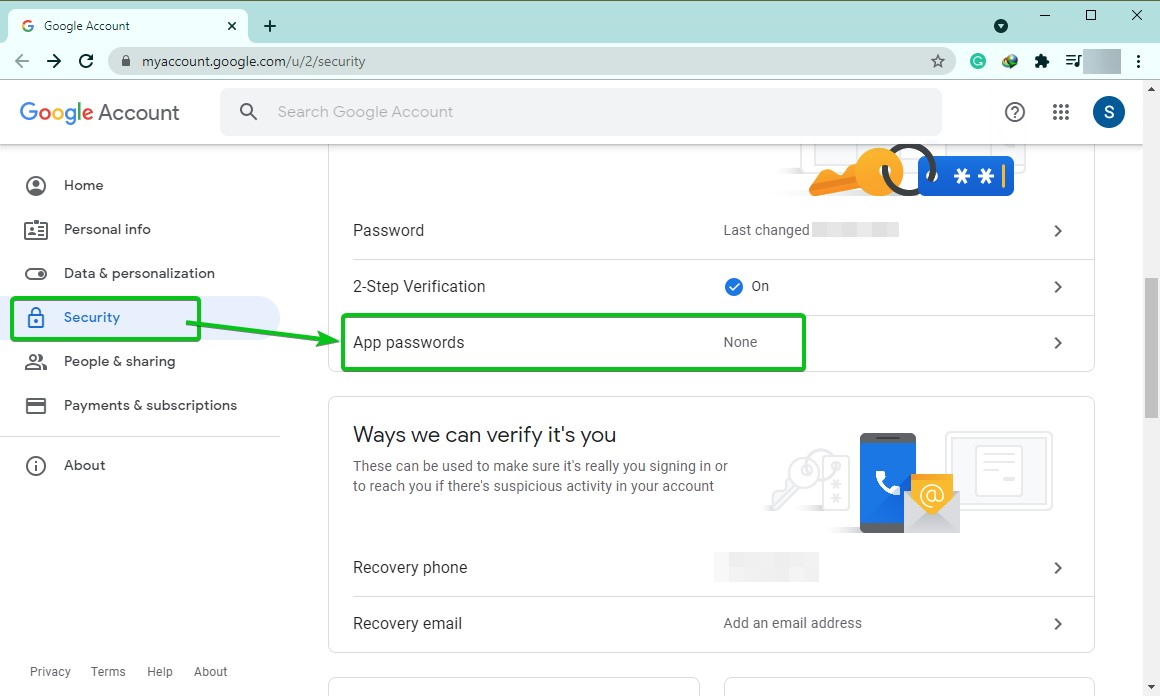
To configure Gmail as the Alert Manager receiver, you must generate an App password for Gmail from the Security settings of your Google Account.
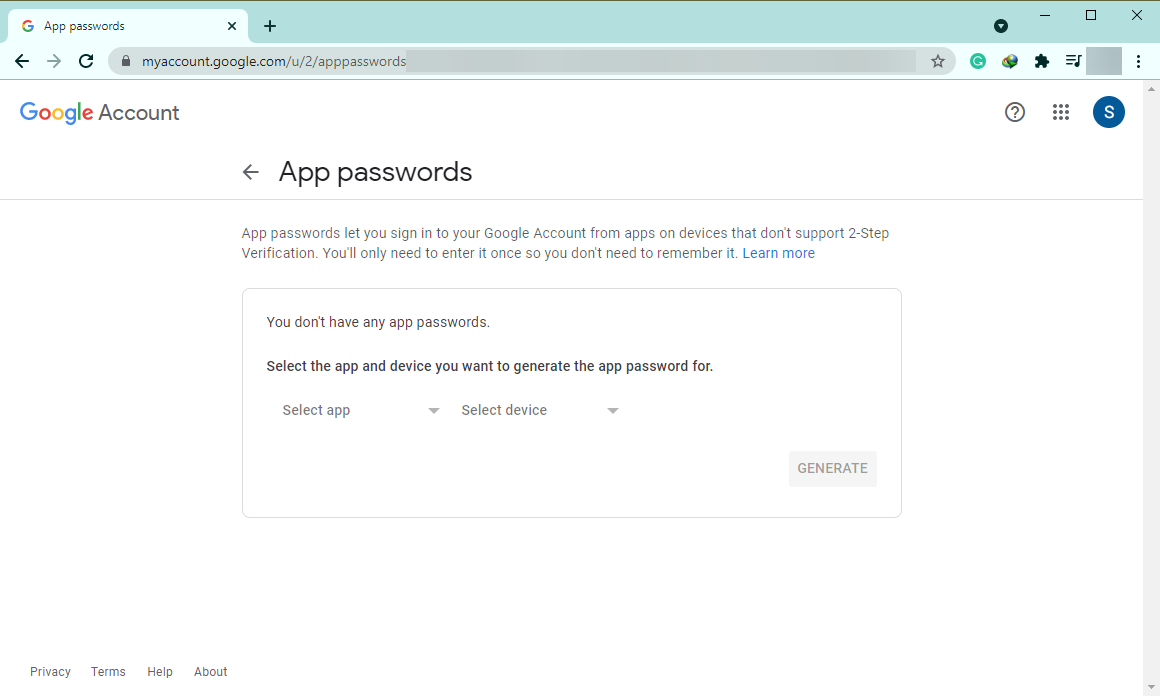
To do that, navigate to URL https://myaccount.google.com from your favorite web browser and click on Security > App passwords as marked in the screenshot below.
You should see the following page.
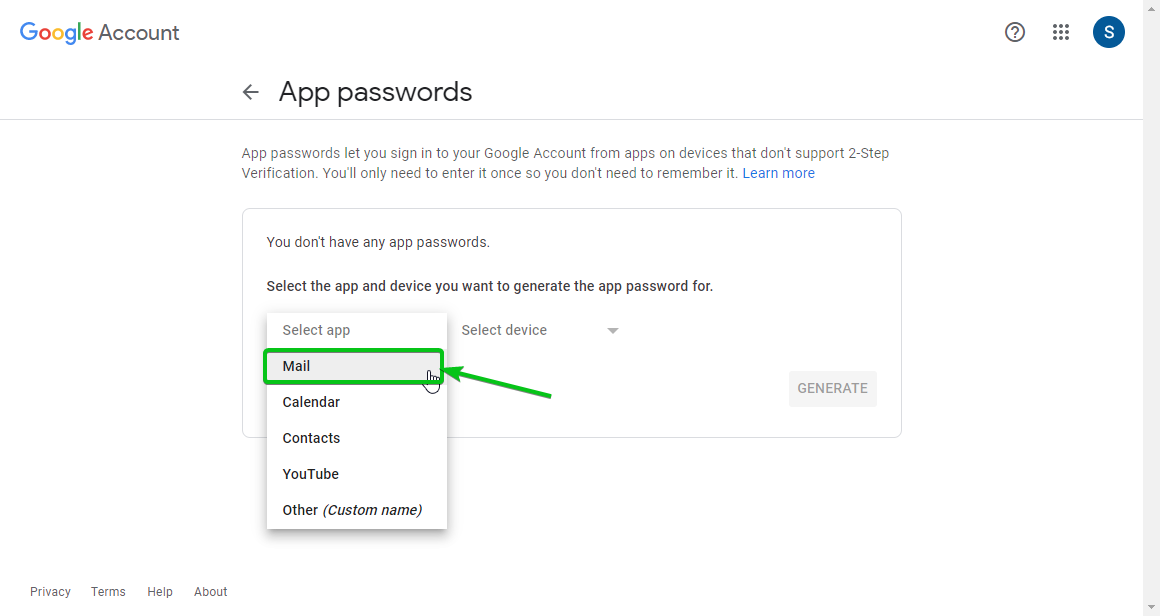
Select Mail from the Select app dropdown menu as marked in the screenshot below.
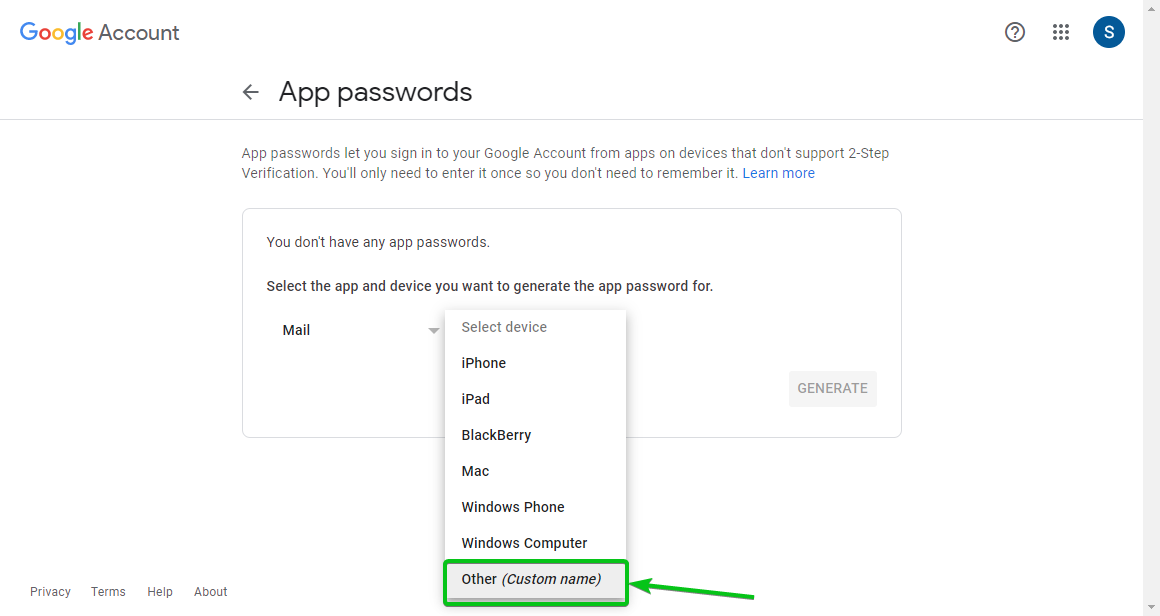
Select Other (Custom name) from the Select device dropdown menu as marked in the screenshot below.
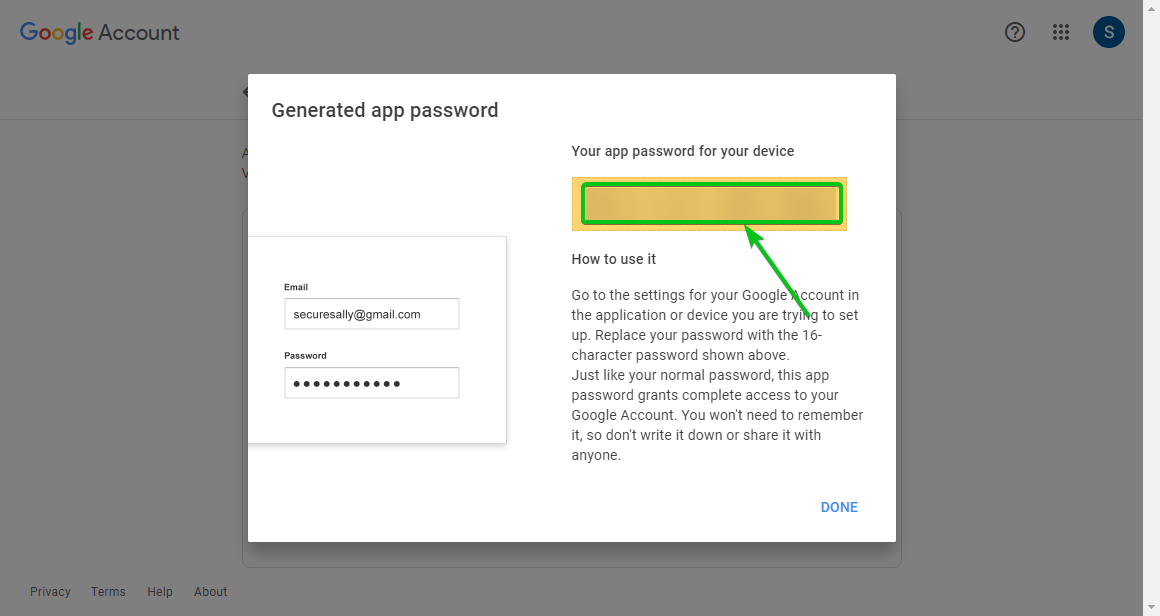
Type in alertmanager (or anything you like) and click on GENERATE as marked in the screenshot below.
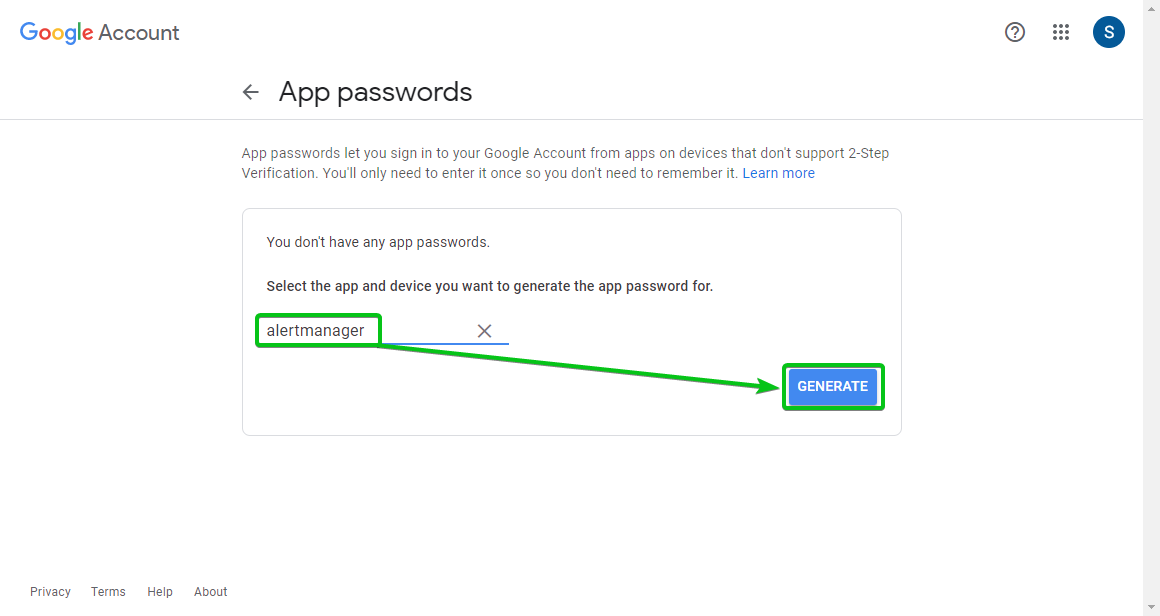
An app password should be generated. Copy it and store it somewhere safe. You will need it later.
Now, open the Alert Manager configuration file /opt/alertmanager/alertmanager.yml with the nano text editor as follows:
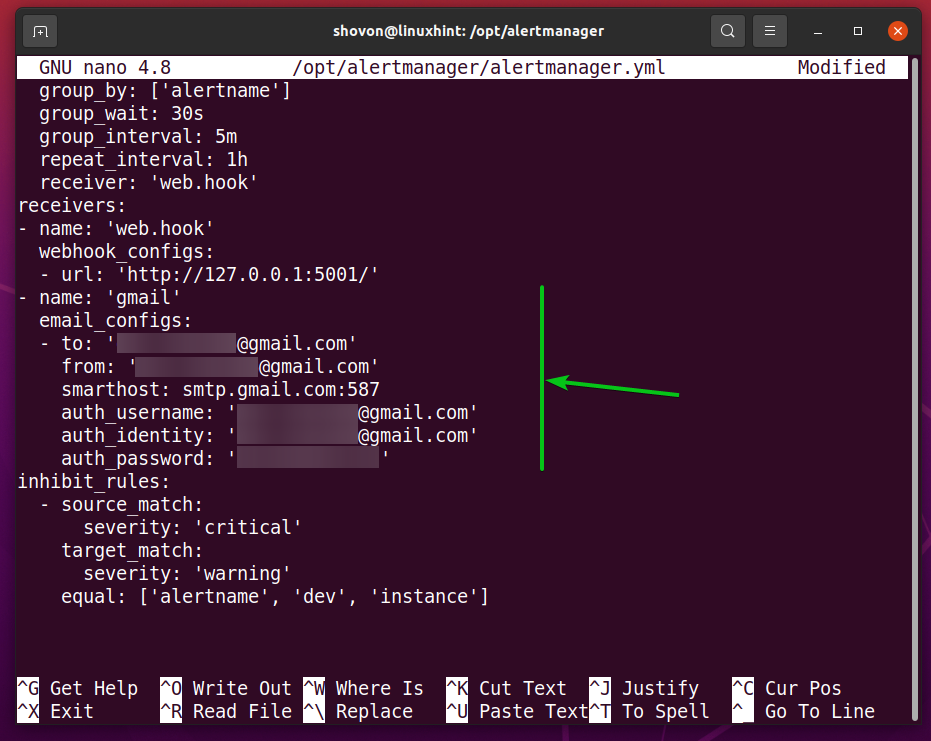
To add a new Gmail receiver, type in the following lines in the receivers section of the alertmanager.yml file as marked in the screenshot below.
email_configs:
- to: '<google-username>@gmail.com'
from: '<google-username>@gmail.com'
smarthost: smtp.gmail.com:587
auth_username: '<google-username>@gmail.com'
auth_identity: '<google-username>@gmail.com'
auth_password: '<google-app-password>'
NOTE: Make sure to replace <google-username> with the username (the part before the @ section of your email) of your Google Account and <google-app-password> with the App password you’ve generated earlier.
Then, set the Alert Manager receiver to gmail (the receiver you’ve just created) as marked in the screenshot below.
Once you’re done, press <Ctrl> + X followed by Y and <Enter> to save the alertmanager.yml configuration file.
Alert Manager will use the gmail receiver from now on.
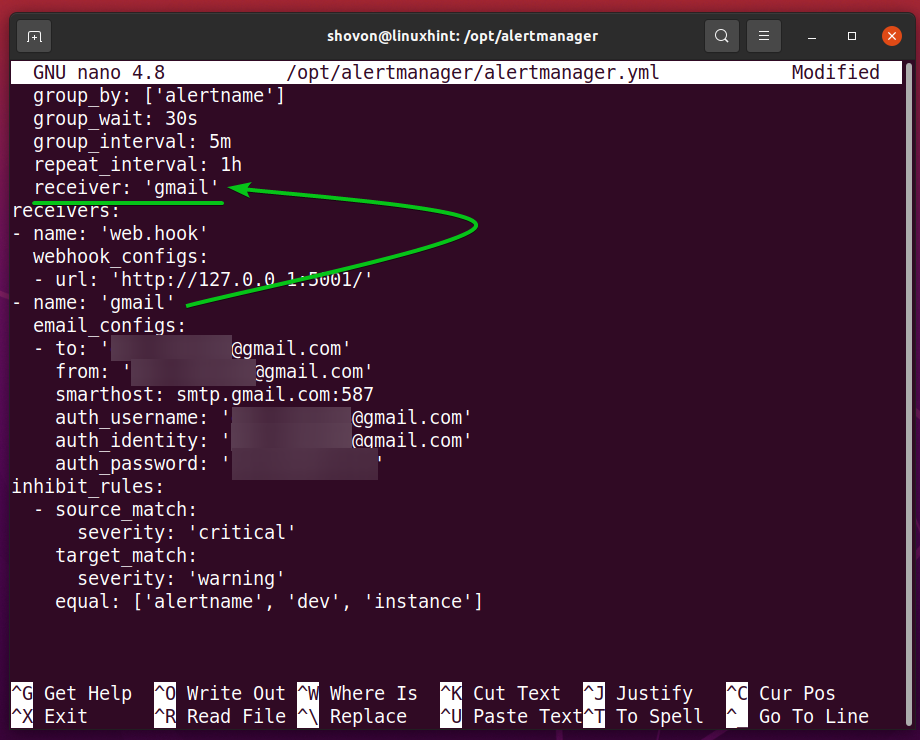
repeat_interval is also an important Alert Manager option. By default, repeat_interval is set to 1h (1 hour). If Alert Manager has successfully sent you an email on your Gmail account, it will wait an hour before sending you another one. If you don’t want to get emails very frequently, you can increase it.

Now, restart the alertmanager systemd service for the changes to take effect as follows:
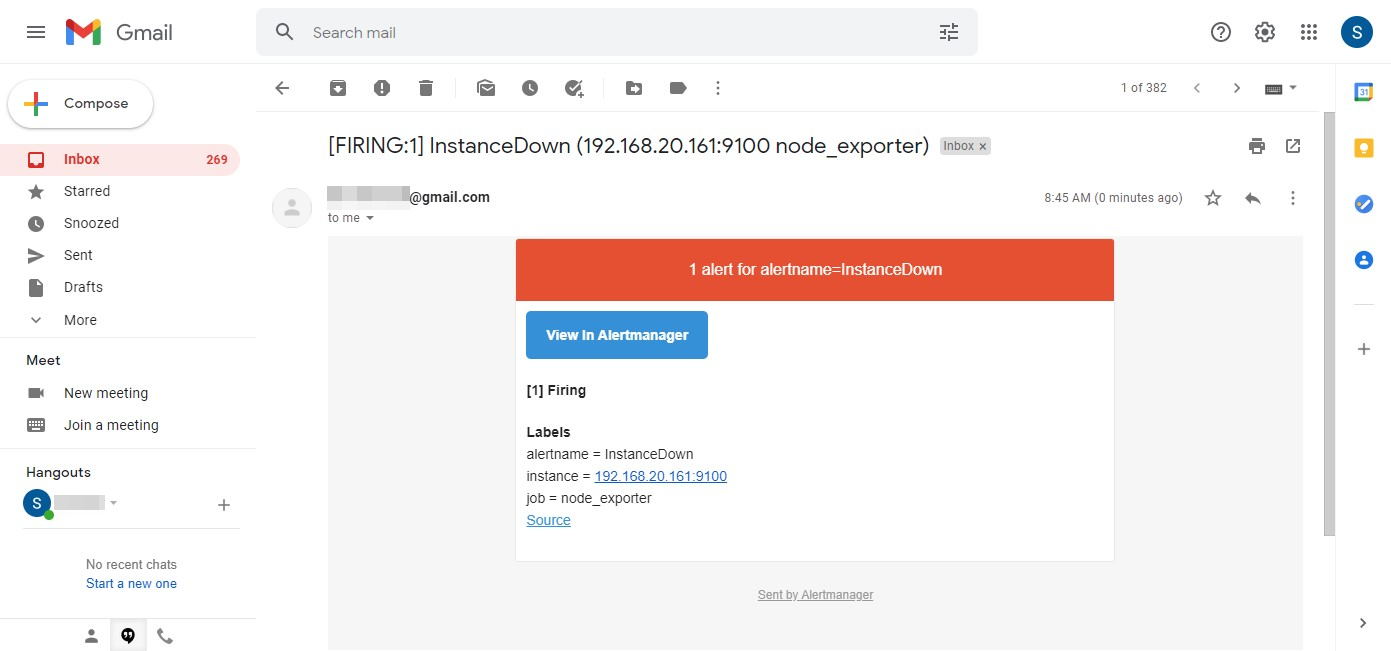
You should get an email shortly in your Gmail account, as you can see in the screenshot below.
You’ve stopped node_exporter earlier, remember?
Troubleshooting Alert Manager E-Mail Delivery Issues:
You can monitor Alert Manager email delivery problems with the following command:
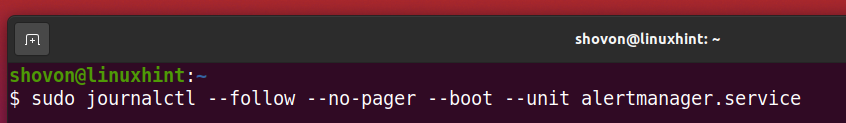
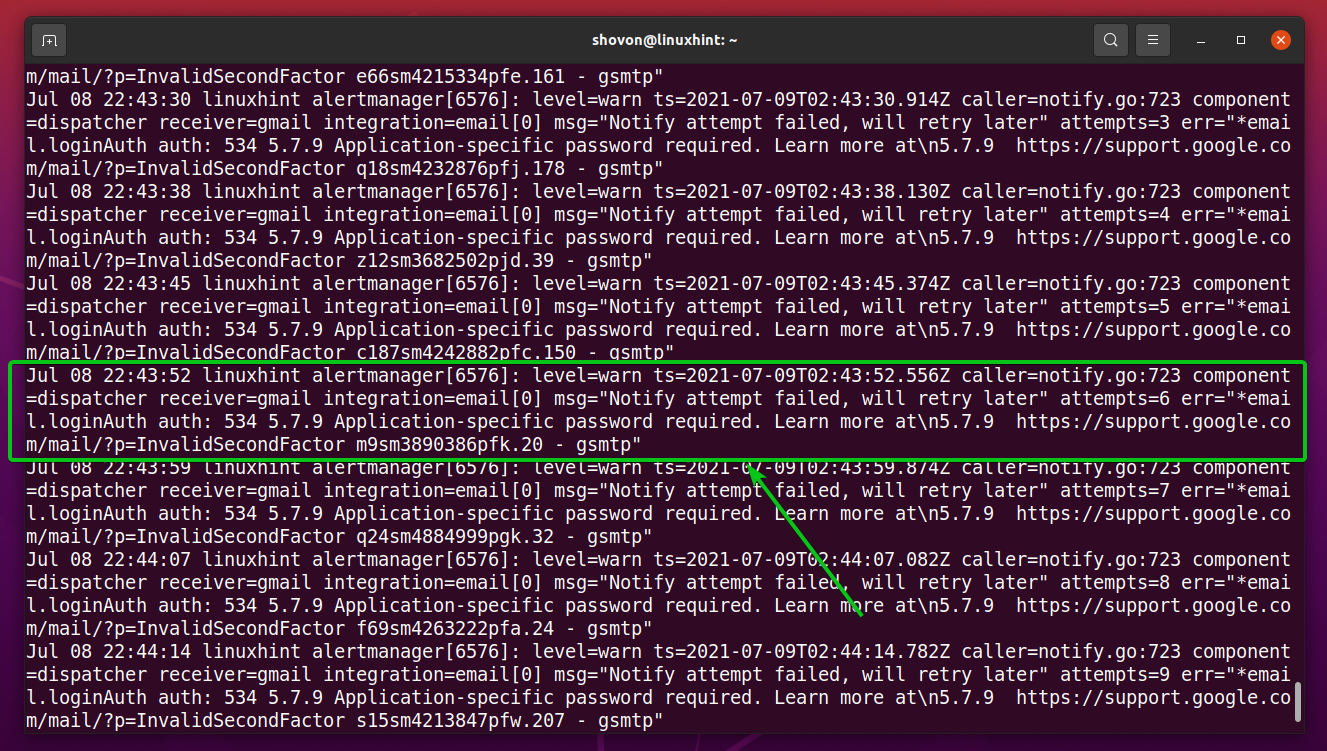
The alertmanager systemd service logs should be displayed, as you can see in the screenshot below.
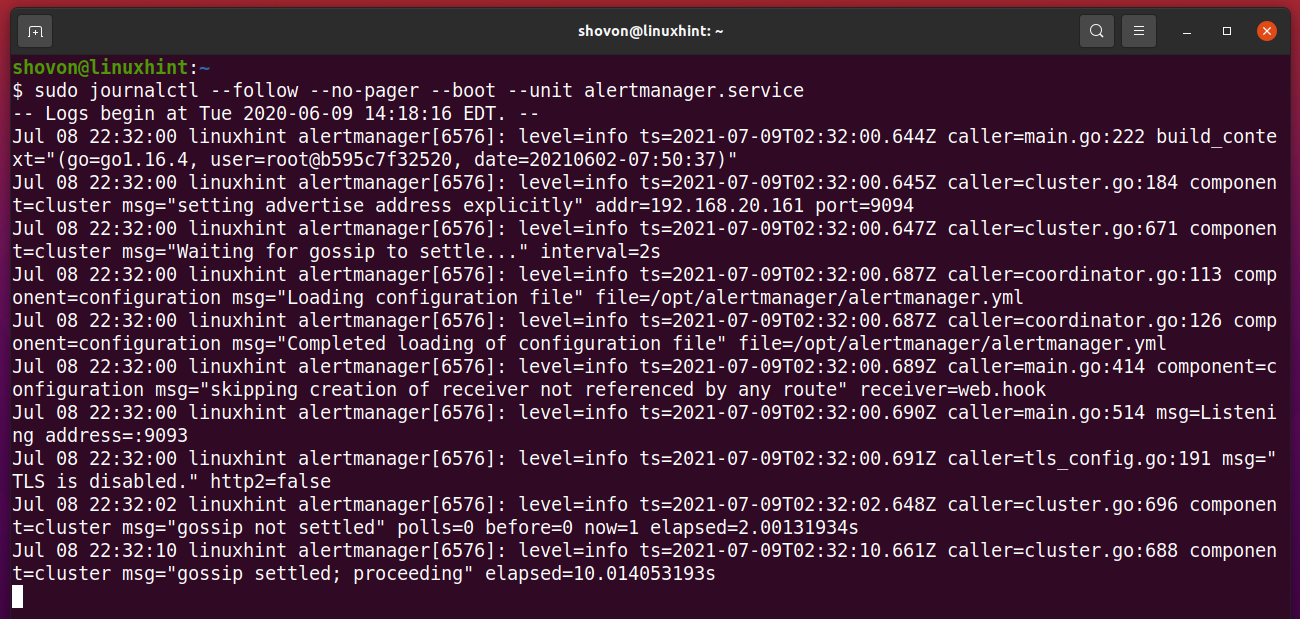
If Alert Manager is unable to deliver emails to your email address, you should be able to find why it failed here.
An example of failed email delivery is shown in the screenshot below. If you read the log message, you should be able to tell that the delivery failed because the password was incorrect.
Conclusion:
In this article, I have shown you how to install Alert Manager on Ubuntu 20.04 LTS. I have also shown you how to configure Alert Manager and Prometheus to send email notifications to your Gmail account when a Prometheus target is DOWN.
References:
from Linux Hint https://ift.tt/3f4itJ7


0 Comments