In this article, we will walk through the basic uses of a group by function in panda’s python. All commands are executed on the Pycharm editor.
Let’s discuss the main concept of the group with the help of the employee’s data. We have created a dataframe with some useful employee details (Employee_Names, Designation, Employee_city, Age).

String Concatenation using Group by Function
Using the groupby function, you can concatenate strings. Same records can be joined with ‘,’ in a single cell.
Example
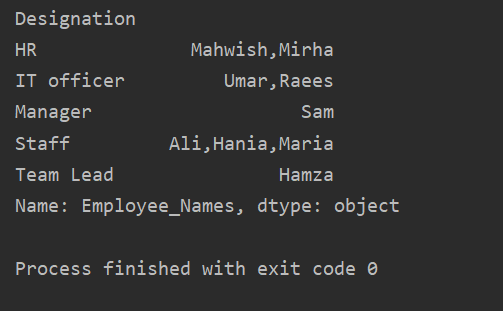
In the following example, we have sorted data based on the employees ‘Designation’ column and joined the Employees who have the same designation. The lambda function is applied on ‘Employees_Name’.
df = pd.DataFrame({
'Employee_Names':['Sam', 'Ali' , 'Umar', 'Raees', 'Mahwish', 'Hania', 'Mirha', 'Maria', 'Hamza'],
'Designation':['Manager', 'Staff', 'IT officer', 'IT officer', 'HR', 'Staff', 'HR', 'Staff', 'Team Lead'],
'Employee_city':['Karachi', 'Karachi', 'Islamabad', 'Islamabad', 'Quetta', 'Lahore', 'Faislabad', 'Lahore', 'Islamabad'],
'Employee_Age':[60, 23, 25, 32, 43, 26, 30, 23, 35]
})
df1=df.groupby("Designation")['Employee_Names'].apply(lambda Employee_Names: ','.join(Employee_Names))
print(df1)
When the above code is executed, the following output displays:
Sorting Values in an ascending order
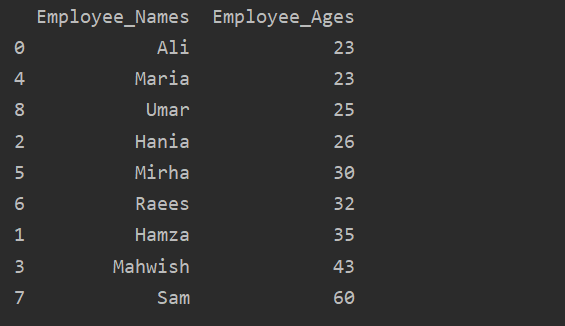
Use the groupby object into a regular dataframe by calling ‘.to_frame()’ and then use reset_index() for reindexing. Sort column values by calling sort_values().
Example
In this example, we will sort the Employee’s age in ascending order. Using the following piece of code, we have retrieved the ‘Employee_Age’ in ascending order with ‘Employee_Names’.
df = pd.DataFrame({
'Employee_Names':['Sam', 'Ali' , 'Umar', 'Raees', 'Mahwish', 'Hania', 'Mirha', 'Maria', 'Hamza'],
'Designation':['Manager', 'Staff', 'IT officer', 'IT officer', 'HR', 'Staff', 'HR', 'Staff', 'Team Lead'],
'Employee_city':['Karachi', 'Karachi', 'Islamabad', 'Islamabad', 'Quetta', 'Lahore', 'Faislabad', 'Lahore', 'Islamabad'],
'Employee_Age':[60, 23, 25, 32, 43, 26, 30, 23, 35]
})
df1=df.groupby('Employee_Names')['Employee_Age'].sum().to_frame().reset_index().sort_values(by='Employee_Age')
print(df1)
Use of aggregates with groupby
There are a number of functions or aggregations available that you can apply on data groups such as count(), sum(), mean(), median(), mode(), std(), min(), max().
Example
In this example, we have used a ‘count()’ function with groupby to count the Employees who belong to the same ‘Employee_city’.
df = pd.DataFrame({
'Employee_Names':['Sam', 'Ali' , 'Umar', 'Raees', 'Mahwish', 'Hania', 'Mirha', 'Maria', 'Hamza'],
'Designation':['Manager', 'Staff', 'IT officer', 'IT officer', 'HR', 'Staff', 'HR', 'Staff', 'Team Lead'],
'Employee_city':['Karachi', 'Karachi', 'Islamabad', 'Islamabad', 'Quetta', 'Lahore', 'Faislabad', 'Lahore', 'Islamabad'],
'Employee_Age':[60, 23, 25, 32, 43, 26, 30, 23, 35]
})
df1=df.groupby('Employee_city').count()
print(df1)
As you can see the following output, under the Designation, Employee_Names, and Employee_Age columns, count numbers that belong to the same city:

Visualize data using groupby
By using the ‘import matplotlib.pyplot’, you can visualize your data into graphs.
Example
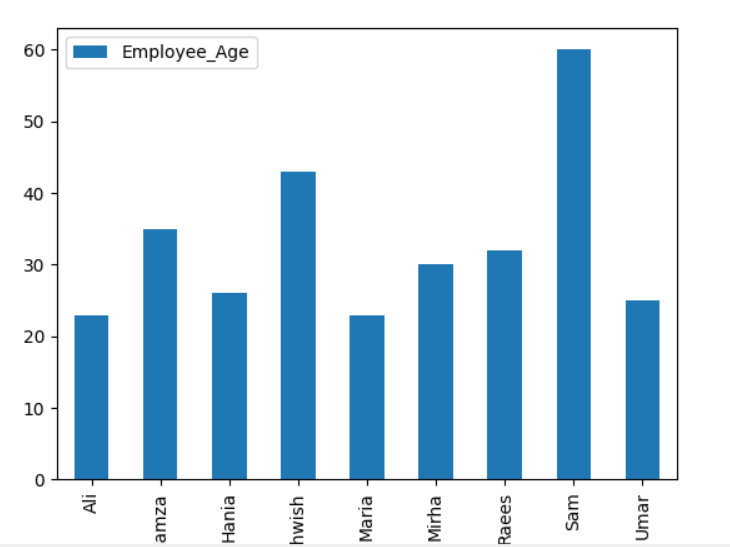
Here, the following example visualizes the ‘Employee_Age’ with ‘Employee_Nmaes’ from the given DataFrame by using the groupby statement.
import matplotlib.pyplot as plt
dataframe = pd.DataFrame({
'Employee_Names':['Sam', 'Ali' , 'Umar', 'Raees', 'Mahwish', 'Hania', 'Mirha', 'Maria', 'Hamza'],
'Designation':['Manager', 'Staff', 'IT officer', 'IT officer', 'HR', 'Staff', 'HR', 'Staff', 'Team Lead'],
'Employee_city':['Karachi', 'Karachi', 'Islamabad', 'Islamabad', 'Quetta', 'Lahore', 'Faislabad', 'Lahore', 'Islamabad'],
'Employee_Age':[60, 23, 25, 32, 43, 26, 30, 23, 35]
})
plt.clf()
dataframe.groupby('Employee_Names').sum().plot(kind='bar')
plt.show()
Example
To plot the stacked graph using groupby, turn the ‘stacked=true’ and use the following code:
import matplotlib.pyplot as plt
df = pd.DataFrame({
'Employee_Names':['Sam', 'Ali' , 'Umar', 'Raees', 'Mahwish', 'Hania', 'Mirha', 'Maria', 'Hamza'],
'Designation':['Manager', 'Staff', 'IT officer', 'IT officer', 'HR', 'Staff', 'HR', 'Staff', 'Team Lead'],
'Employee_city':['Karachi', 'Karachi', 'Islamabad', 'Islamabad', 'Quetta', 'Lahore', 'Faislabad', 'Lahore', 'Islamabad'],
'Employee_Age':[60, 23, 25, 32, 43, 26, 30, 23, 35]
})
df.groupby(['Employee_city','Employee_Names']).size().unstack().plot(kind='bar',stacked=True, fontsize='6')
plt.show()
In the below-given graph, the number of employees stacked who belong to the same city.

Change Column Name with the group by
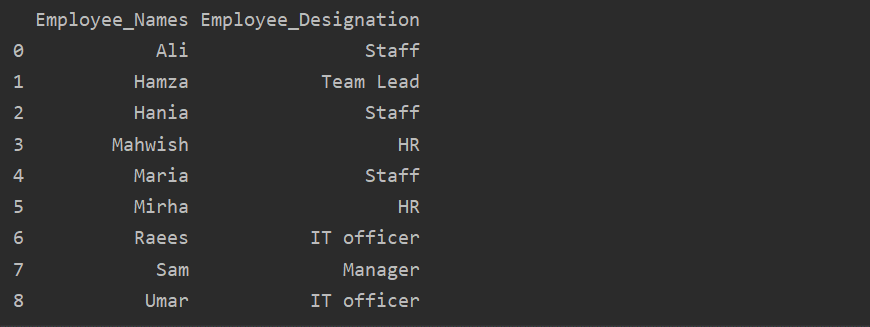
You can also change the aggregated column name with some new modified name as follows:
import matplotlib.pyplot as plt
df = pd.DataFrame({
'Employee_Names':['Sam', 'Ali' , 'Umar', 'Raees', 'Mahwish', 'Hania', 'Mirha', 'Maria', 'Hamza'],
'Designation':['Manager', 'Staff', 'IT officer', 'IT officer', 'HR', 'Staff', 'HR', 'Staff', 'Team Lead'],
'Employee_city':['Karachi', 'Karachi', 'Islamabad', 'Islamabad', 'Quetta', 'Lahore', 'Faislabad', 'Lahore', 'Islamabad'],
'Employee_Age':[60, 23, 25, 32, 43, 26, 30, 23, 35]
})
df1 = df.groupby('Employee_Names')['Designation'].sum().reset_index(name='Employee_Designation')
print(df1)
In the above example, the ‘Designation’ name is changed to ‘Employee_Designation’.
Retrieve Group by key or value
Using the groupby statement, you can retrieve similar records or values from the dataframe.
Example
In the below-given example, we have group data based on ‘Designation’. Then, the ‘Staff’ group is retrieved by using the .getgroup(‘Staff’).
import matplotlib.pyplot as plt
df = pd.DataFrame({
'Employee_Names':['Sam', 'Ali' , 'Umar', 'Raees', 'Mahwish', 'Hania', 'Mirha', 'Maria', 'Hamza'],
'Designation':['Manager', 'Staff', 'IT officer', 'IT officer', 'HR', 'Staff', 'HR', 'Staff', 'Team Lead'],
'Employee_city':['Karachi', 'Karachi', 'Islamabad', 'Islamabad', 'Quetta', 'Lahore', 'Faislabad', 'Lahore', 'Islamabad'],
'Employee_Age':[60, 23, 25, 32, 43, 26, 30, 23, 35]
})
extract_value = df.groupby('Designation')
print(extract_value.get_group('Staff'))
The following result displays in the output window:

Add Value into group List
Similar data can be displayed in the form of a list by using the groupby statement. First, group the data based on a condition. Then, by applying the function, you can easily put this group into the lists.
Example
In this example, we have inserted similar records into the group list. All the employees are divided into the group based on ’Employee_city’, and then by applying the ‘Lambda’ function, this group is retrieved in the form of a list.
df = pd.DataFrame({
'Employee_Names':['Sam', 'Ali' , 'Umar', 'Raees', 'Mahwish', 'Hania', 'Mirha', 'Maria', 'Hamza'],
'Designation':['Manager', 'Staff', 'IT officer', 'IT officer', 'HR', 'Staff', 'HR', 'Staff', 'Team Lead'],
'Employee_city':['Karachi', 'Karachi', 'Islamabad', 'Islamabad', 'Quetta', 'Lahore', 'Faislabad', 'Lahore', 'Islamabad'],
'Employee_Age':[60, 23, 25, 32, 43, 26, 30, 23, 35]
})
df1=df.groupby('Employee_city')['Employee_Names'].apply(lambda group_series: group_series.tolist()).reset_index()
print(df1)

Use of Transform function with groupby
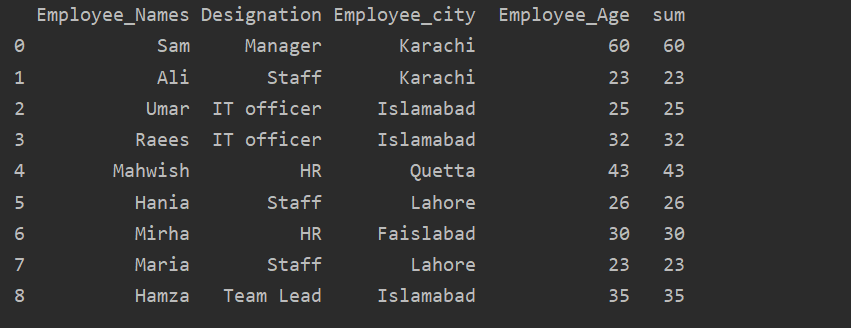
The employees are grouped according to their age, these values added together, and by using the ‘transform’ function new column is added in the table:
df = pd.DataFrame({
'Employee_Names':['Sam', 'Ali' , 'Umar', 'Raees', 'Mahwish', 'Hania', 'Mirha', 'Maria', 'Hamza'],
'Designation':['Manager', 'Staff', 'IT officer', 'IT officer', 'HR', 'Staff', 'HR', 'Staff', 'Team Lead'],
'Employee_city':['Karachi', 'Karachi', 'Islamabad', 'Islamabad', 'Quetta', 'Lahore', 'Faislabad', 'Lahore', 'Islamabad'],
'Employee_Age':[60, 23, 25, 32, 43, 26, 30, 23, 35]
})
df['sum']=df.groupby(['Employee_Names'])['Employee_Age'].transform('sum')
print(df)
Conclusion
We have explored the different uses of groupby statement in this article. We have shown how you can divide the data into groups, and by applying different aggregations or functions, you can easily retrieve these groups.
from Linux Hint https://ift.tt/3bMqkIW


0 Comments