Zabbix is an open-source monitoring tool in which you can monitor your servers, virtual machines, networks, cloud services, and many more. It is a very useful tool for small, medium, and large IT organizations.
You can install the Zabbix on the Raspberry Pi and monitor the network of other computers/servers in your home network using it.
In this article, I am going to show you how to set up Zabbix on your Raspberry Pi to monitor the network of other computers/servers in your home network.
Things You Will Need
To follow this article, you need a Raspberry Pi single-board computer with Zabbix 5 installed on it.
If you need any assistance on installing Zabbix 5 on your Raspberry Pi single-board computer, read my article on How to Install Zabbix 5 on Raspberry Pi 4.
I have installed Zabbix 5 on my Raspberry Pi (running the Raspberry Pi OS). The IP address of my Raspberry Pi is 192.168.0.106. So, I will be accessing the Zabbix 5 web app using the URL http://192.168.0.106/zabbix. The IP address of your Raspberry Pi will be different. So make sure to replace it with yours from now on.
What is Zabbix Agent?
Zabbix has 2 components: 1) Zabbix Server and 2) Zabbix Agent.
If you want to monitor your computer/server with Zabbix, you must have the Zabbix Agent installed and running on your computer/server. It will communicate and send necessary data to the Zabbix Server (running on your Raspberry Pi).
Installing Zabbix Agent on Ubuntu/Debian/Raspberry Pi OS
Zabbix Agent is available in the official package repository of Ubuntu/Debian/Raspberry Pi OS. So, it is easy to install.
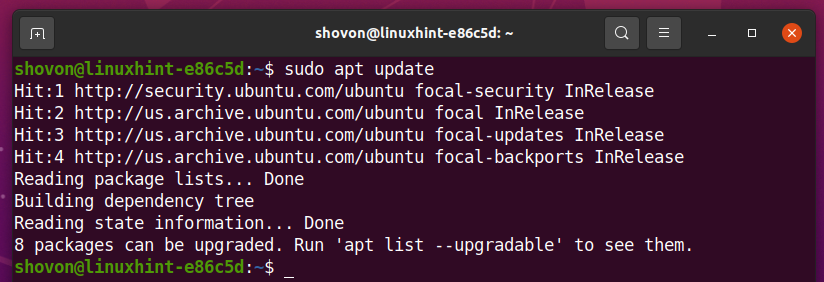
First, update the APT package repository cache with the following command:
You can install the Zabbix Agent with the following command:

Zabbix Agent should be installed.
Open the Zabbix Agent configuration file /etc/zabbix/zabbix_agentd.conf with the following command:

Change the Server variable to the IP address of your Zabbix Server (the IP address of your Raspberry Pi).
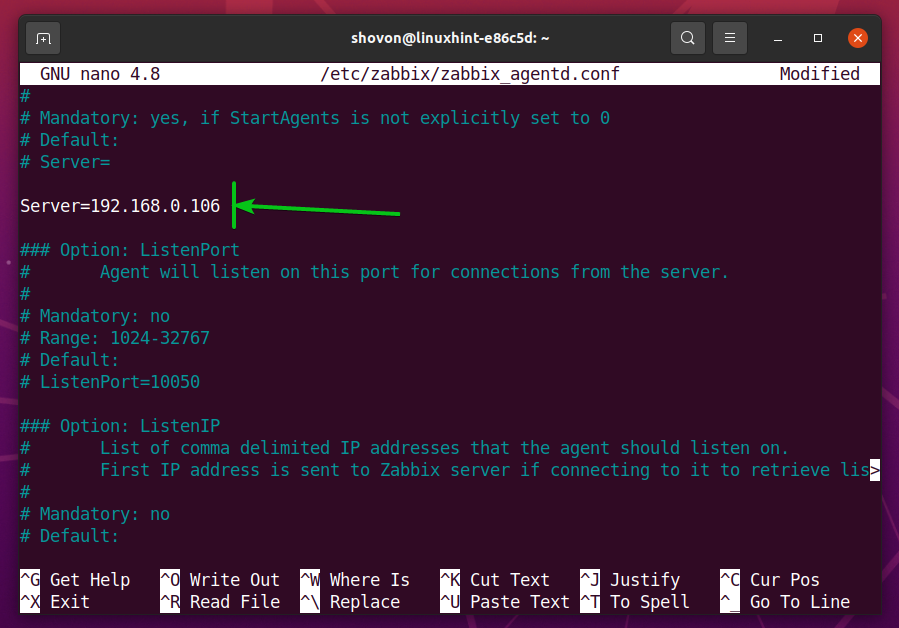
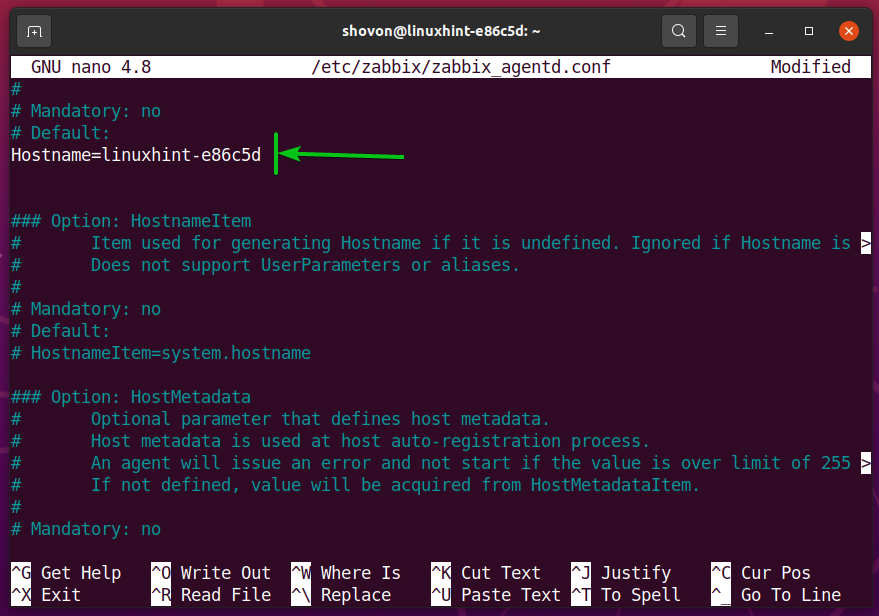
Also, make sure that the Hostname variable is set to the hostname of your computer/server. If you don’t know the hostname of your computer/server, you can run the hostname command and find it out.
Once you’re done, press <Ctrl> + X followed by Y and <Enter> to save the /etc/zabbix/zabbix_agentd.conf file.
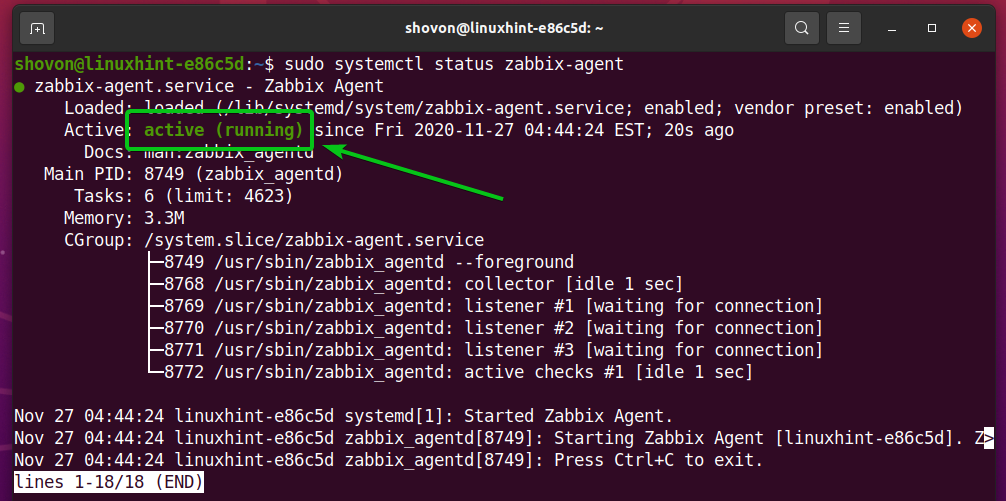
For the changes to take effect, restart the zabbix-agent service with the following command:

The zabbix-agent should be running, as you can see in the screenshot below.
Installing Zabbix Agent on CentOS/RHEL 8
To install Zabbix Agent on CentOS/RHEL 8, you must add the Zabbix package repository to your CentOS/RHEL 8 computer/server.
To add the Zabbix package repository to your CentOS/RHEL 8, run the following command:

The Zabbix Package repository should be added.

Update the DNF package repository cache with the following command:

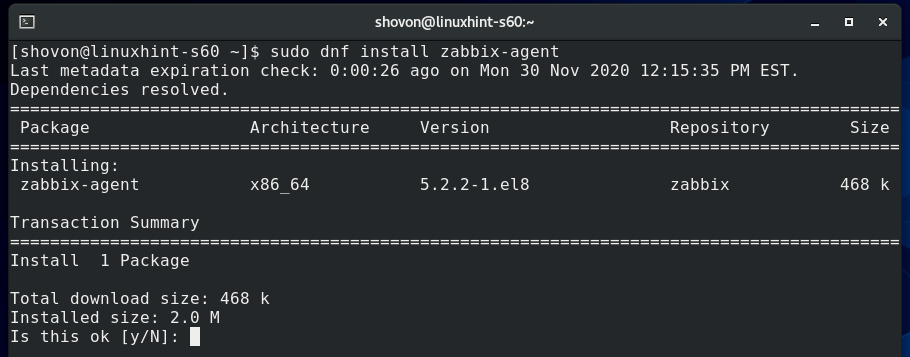
To install Zabbix Agent, run the following command:

To confirm the installation, press Y, and then press <Enter>.
To accept the GPG key, press Y, and then press <Enter>.
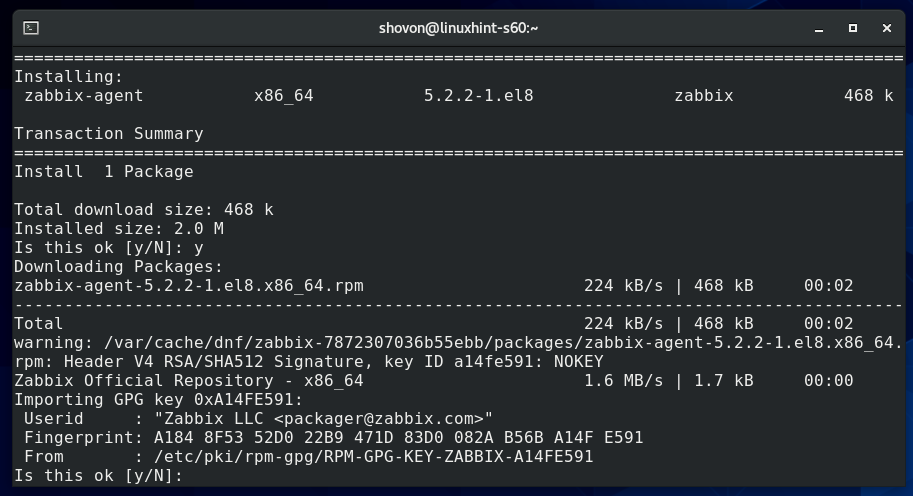
Zabbix Agent should be installed.
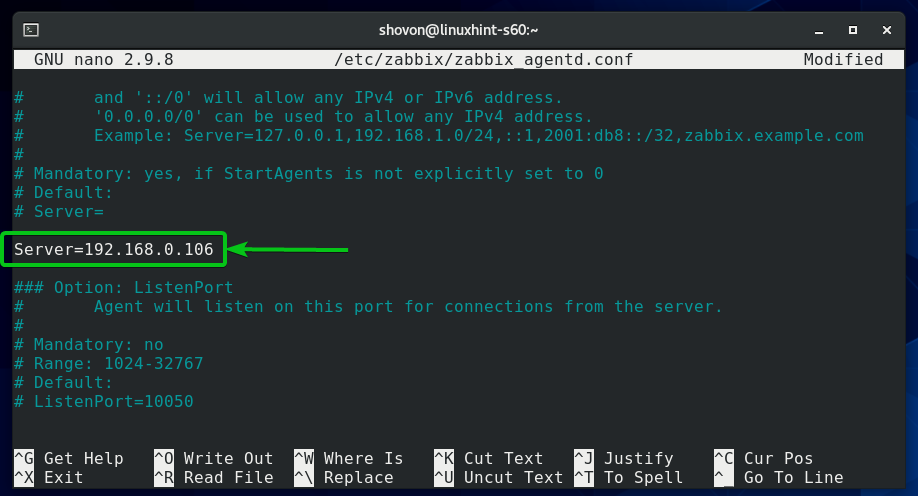
Open the Zabbix Agent configuration file /etc/zabbix/zabbix_agentd.conf with the following command:

Change the Server variable to the IP address of your Zabbix Server (the IP address of your Raspberry Pi).
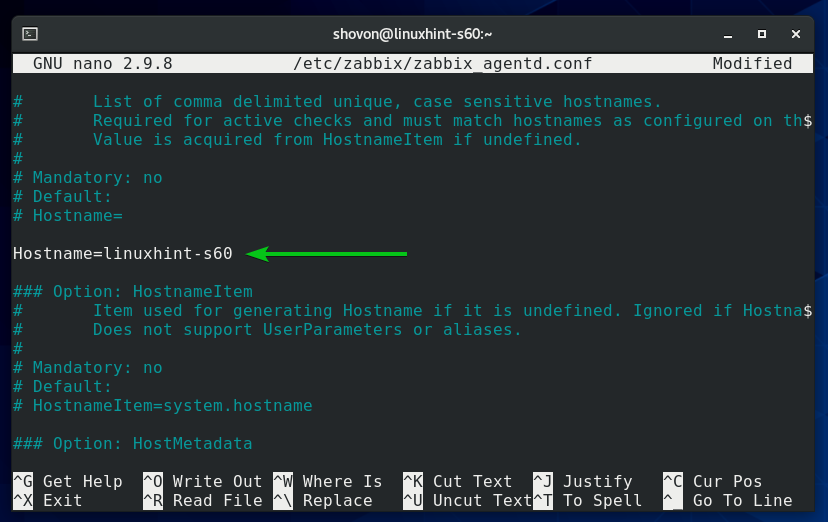
Also, make sure that the Hostname variable is set to the hostname of your computer/server. If you don’t know the hostname of your computer/server, you can run the hostname command and find it out.
Once you’re done, press <Ctrl> + X followed by Y and <Enter> to save the /etc/zabbix/zabbix_agentd.conf file.
Start the zabbix-agent systemd service with the following command:

The zabbix-agent service should be running, as you can see in the screenshot below.
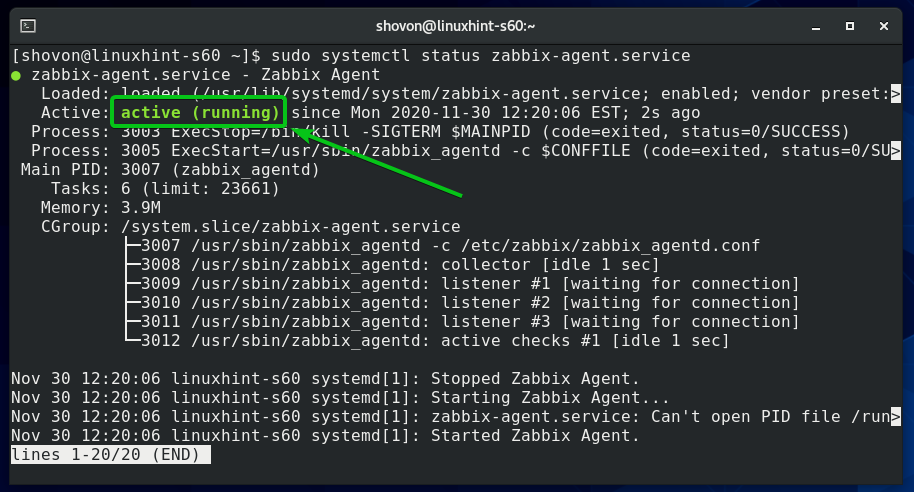
Add the zabbix-agent service to the system startup so that it starts automatically on system boot:

Run the following command to configure the firewall to allow access to the Zabbix Agent port 10050:

For the firewall changes to take effect, run the following command:

Installing Zabbix Agent on Windows 10
On Windows 10, you have to download the Zabbix Agent software from the official website of Zabbix.
First, visit the official download page of Zabbix Agent from a web browser.
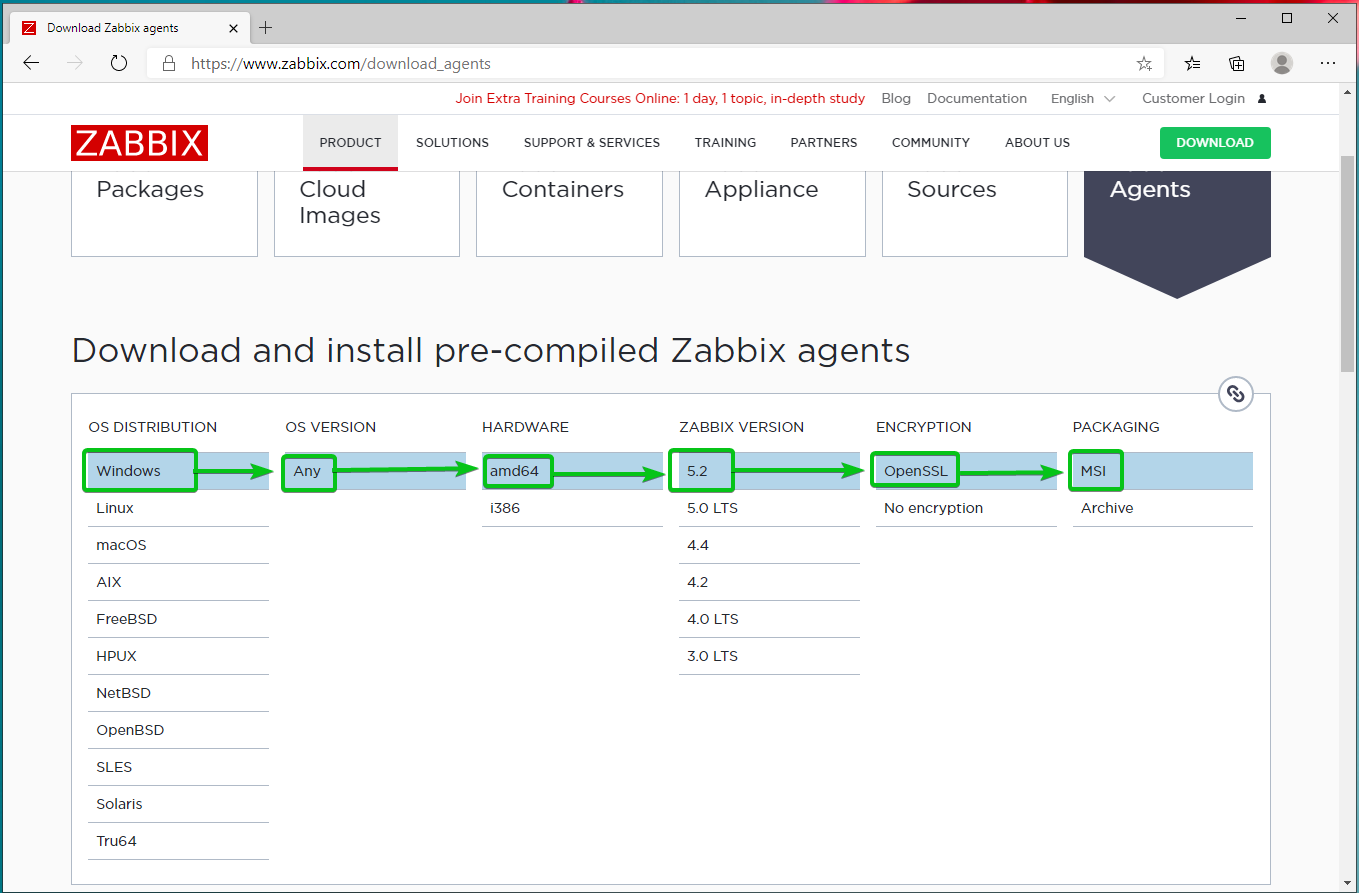
Once the page loads, select the Windows MSI package as marked in the screenshot below.
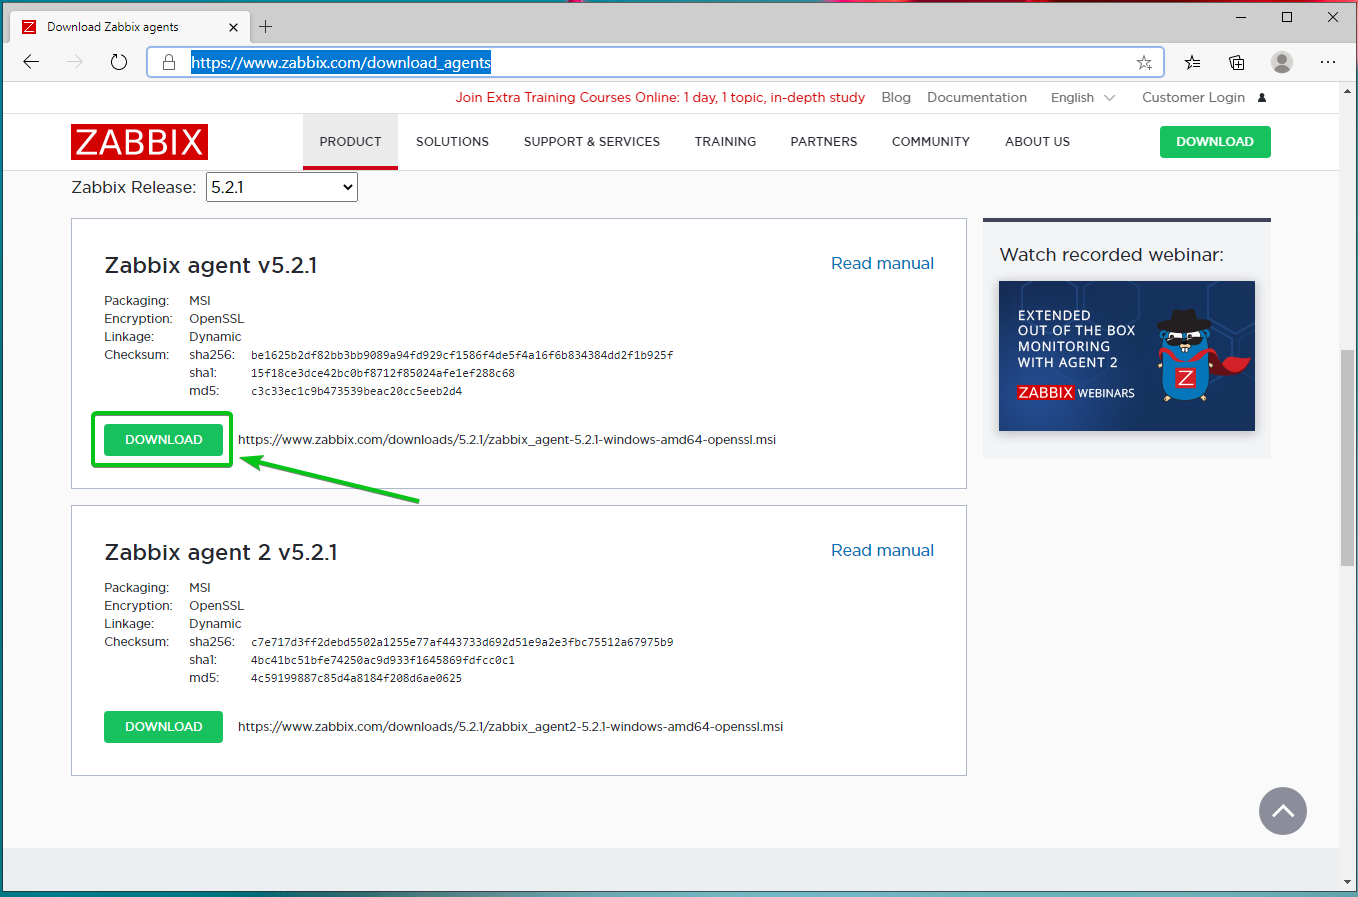
Then, scroll down a little bit, and click on the first DOWNLOAD link as marked in the screenshot below.
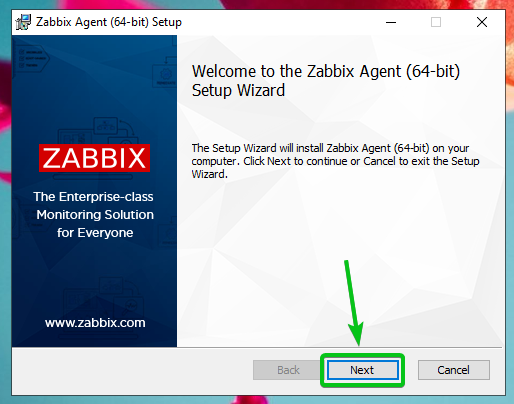
Zabbix Agent installer should be downloaded. Run the installer.

Click on Next.
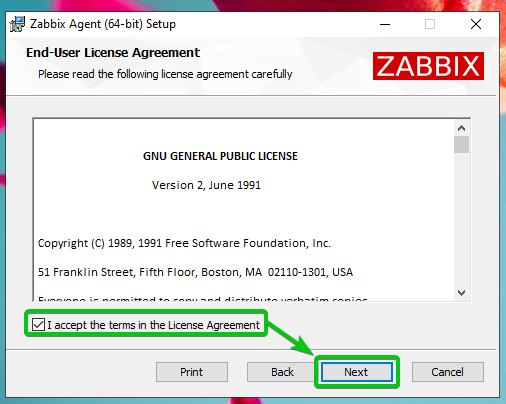
Check the I accept the terms in the License Agreement checkbox and click on Next.
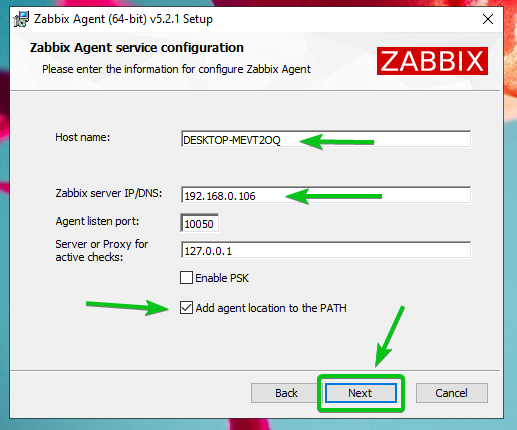
Make sure that the hostname is correct. Type in the Zabbix server IP address and check the Add agent location to the PATH checkbox.
Once you’re done, click on Next.
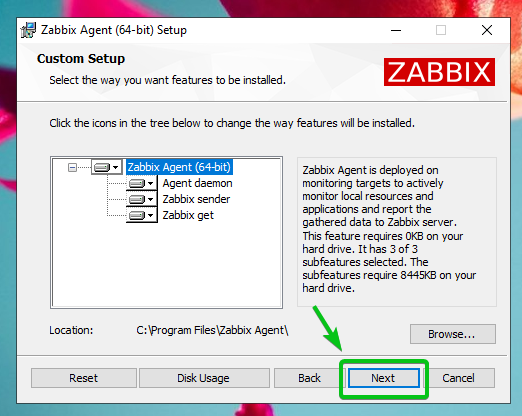
Click on Next.
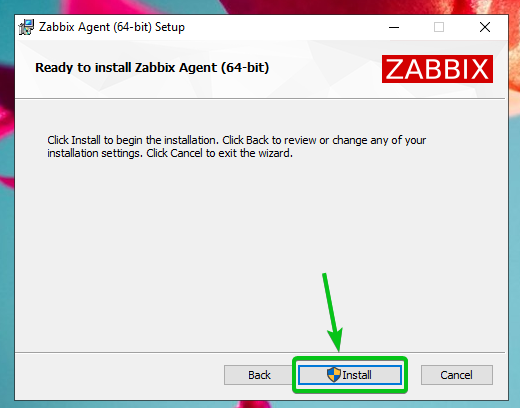
Click on Install.
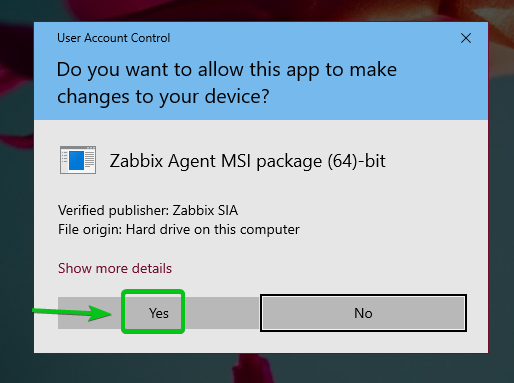
Click on Yes.
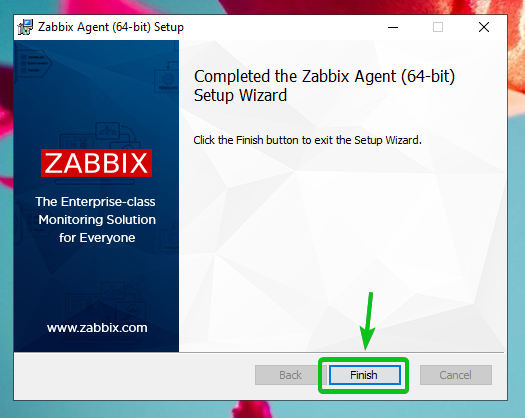
Zabbix Agent should be installed. Click on Finish.
Adding a Linux Host to Zabbix
Once the Zabbix Agent is installed on your computer/server, you can add it to the Zabbix Server (running on your Raspberry Pi).
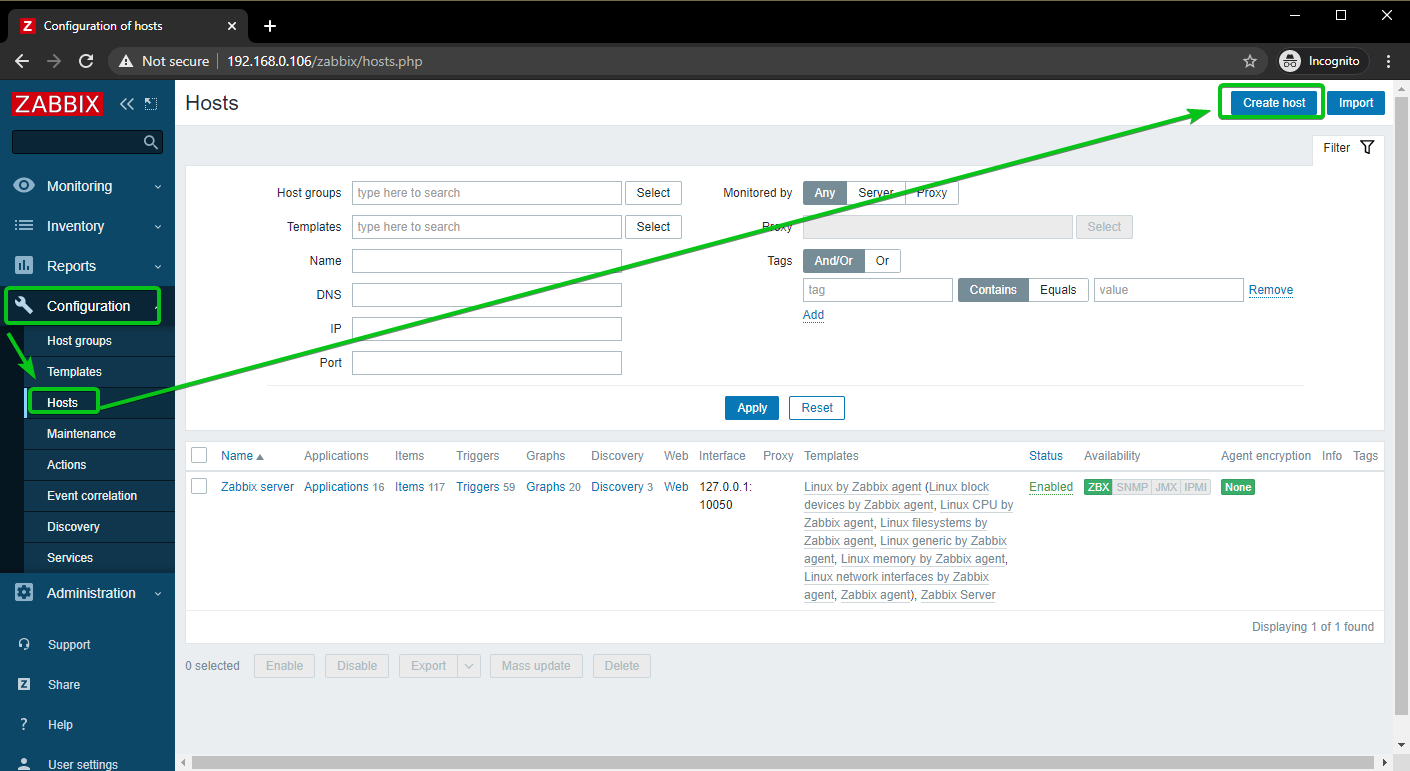
First, log in to the Zabbix web app and go to Configuration > Hosts. Then, click on Create host, as marked in the screenshot below.
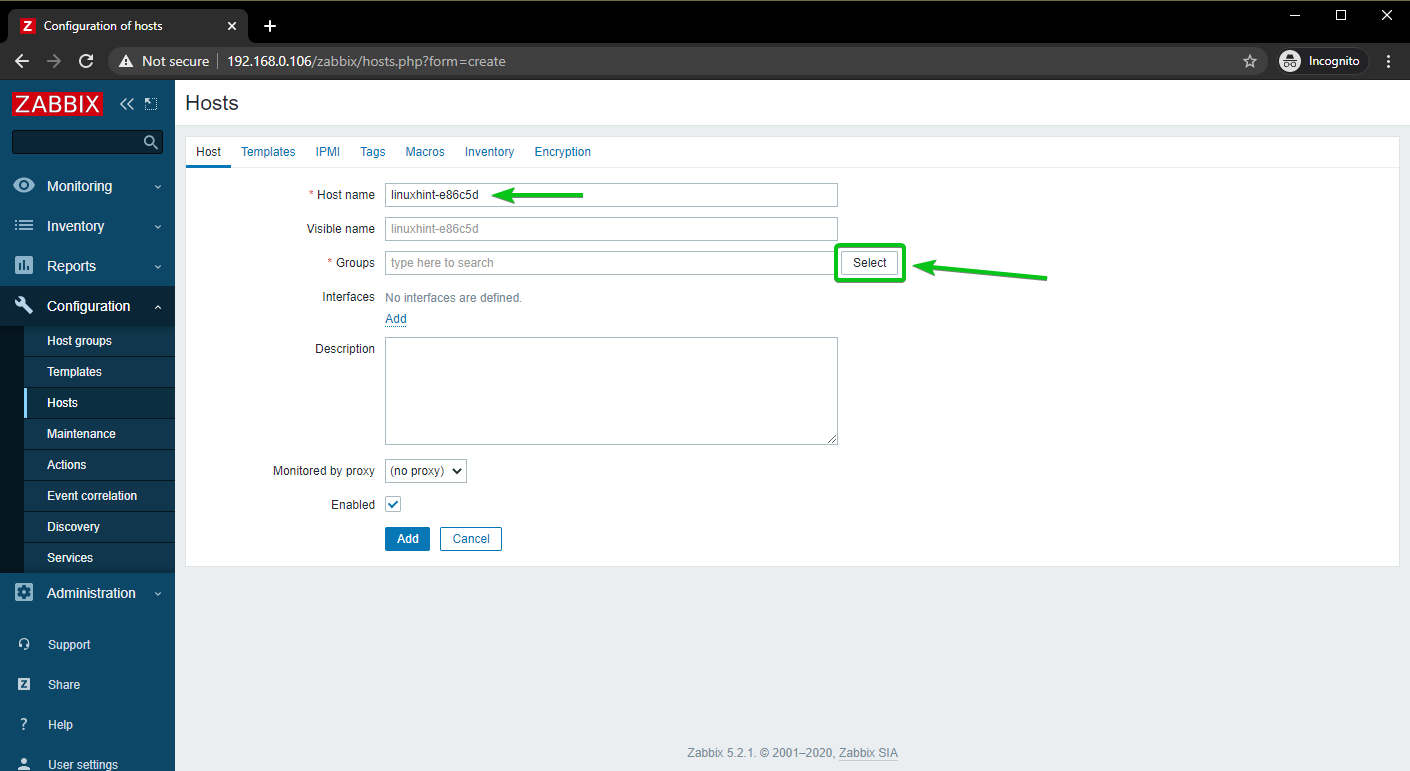
Type in the hostname of the computer/server you’re trying to add in the Host name field. Then, click on Select, as marked in the screenshot below.
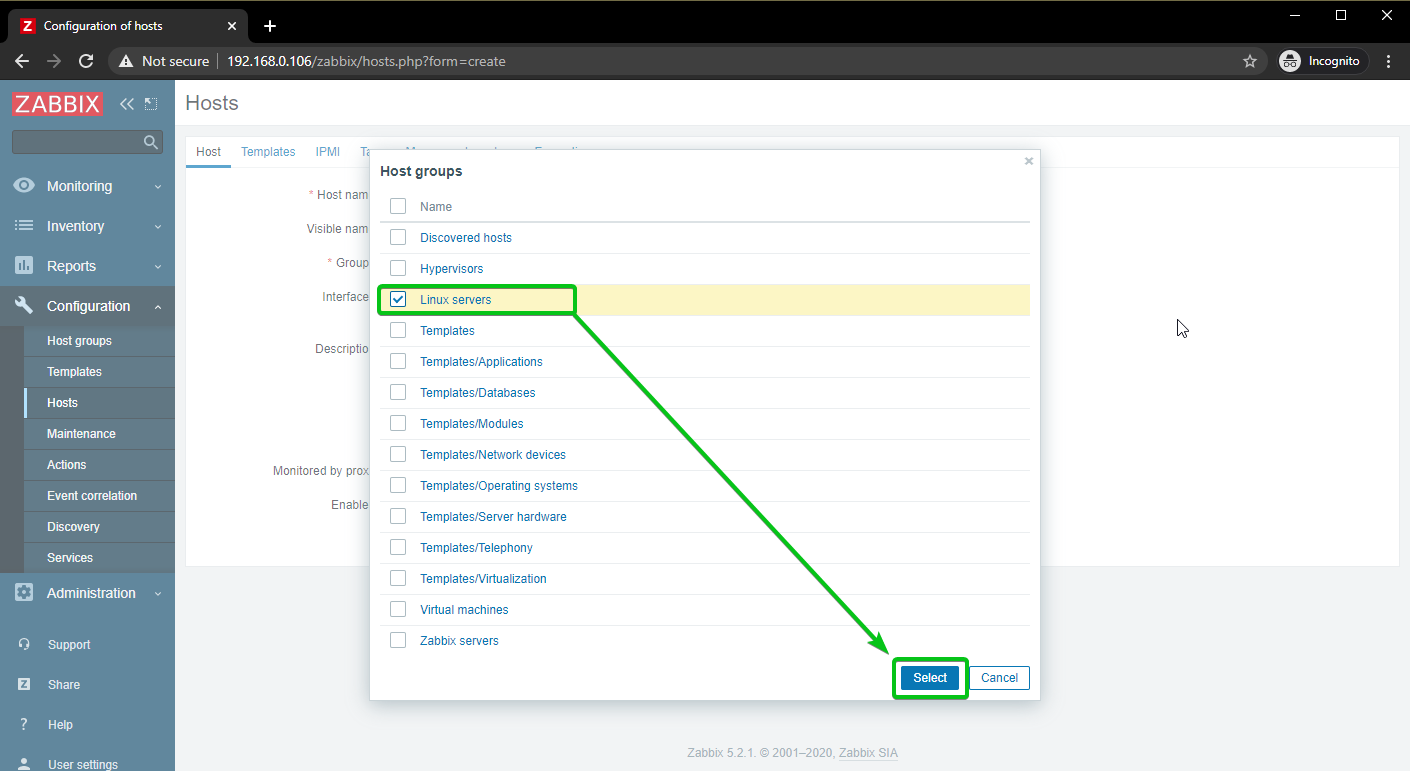
Check the Linux servers checkbox, and click on Select.
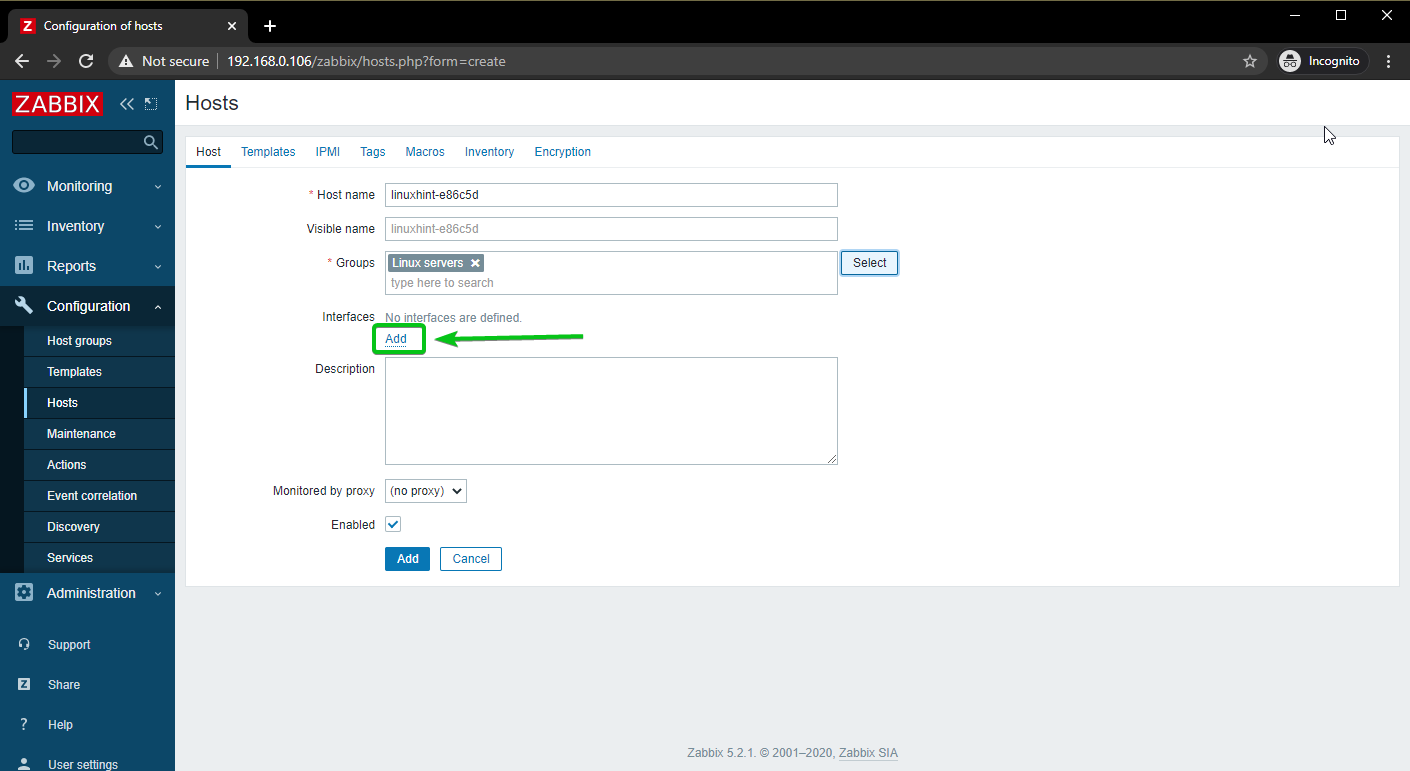
Click on Add, as marked in the screenshot below.
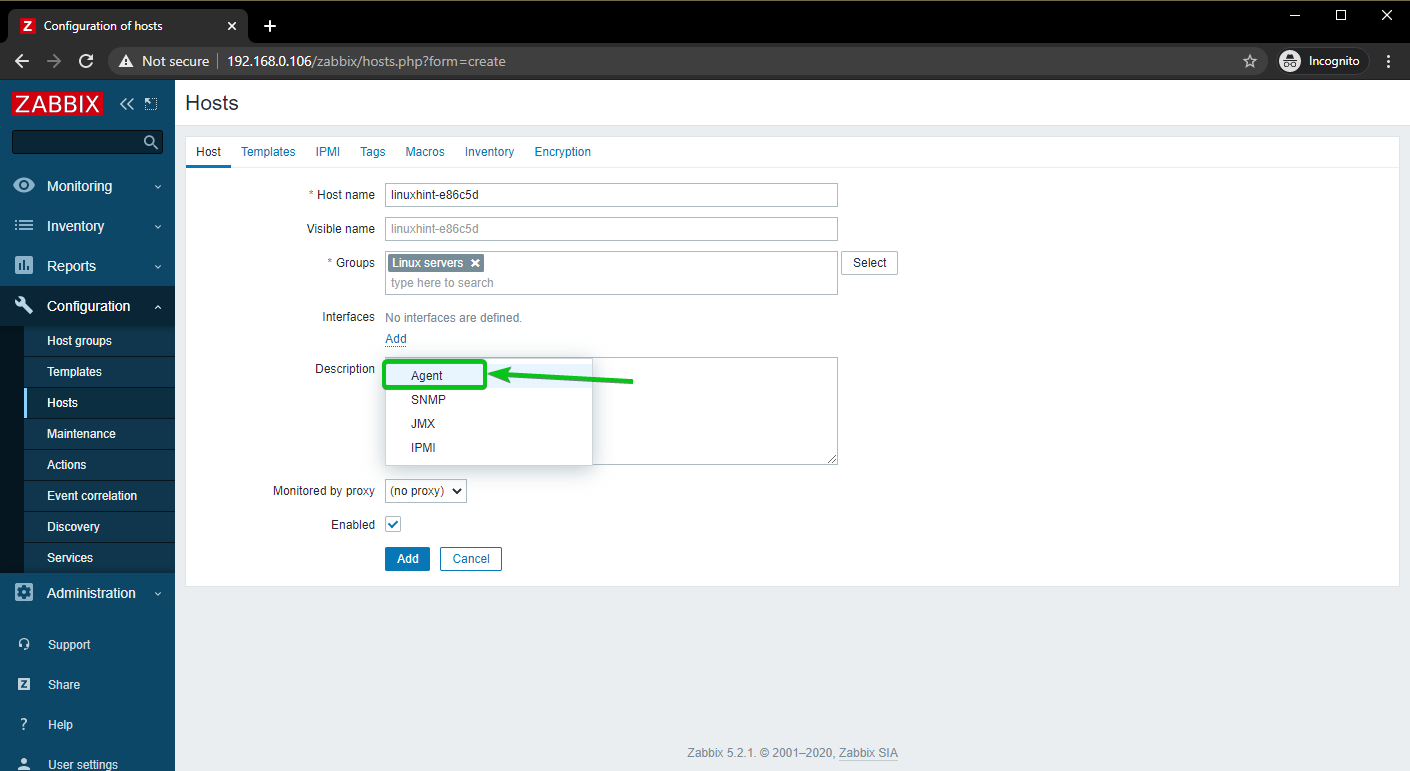
Click on Agent.
Type in the IP address of the computer/server you’re trying to add to Zabbix.
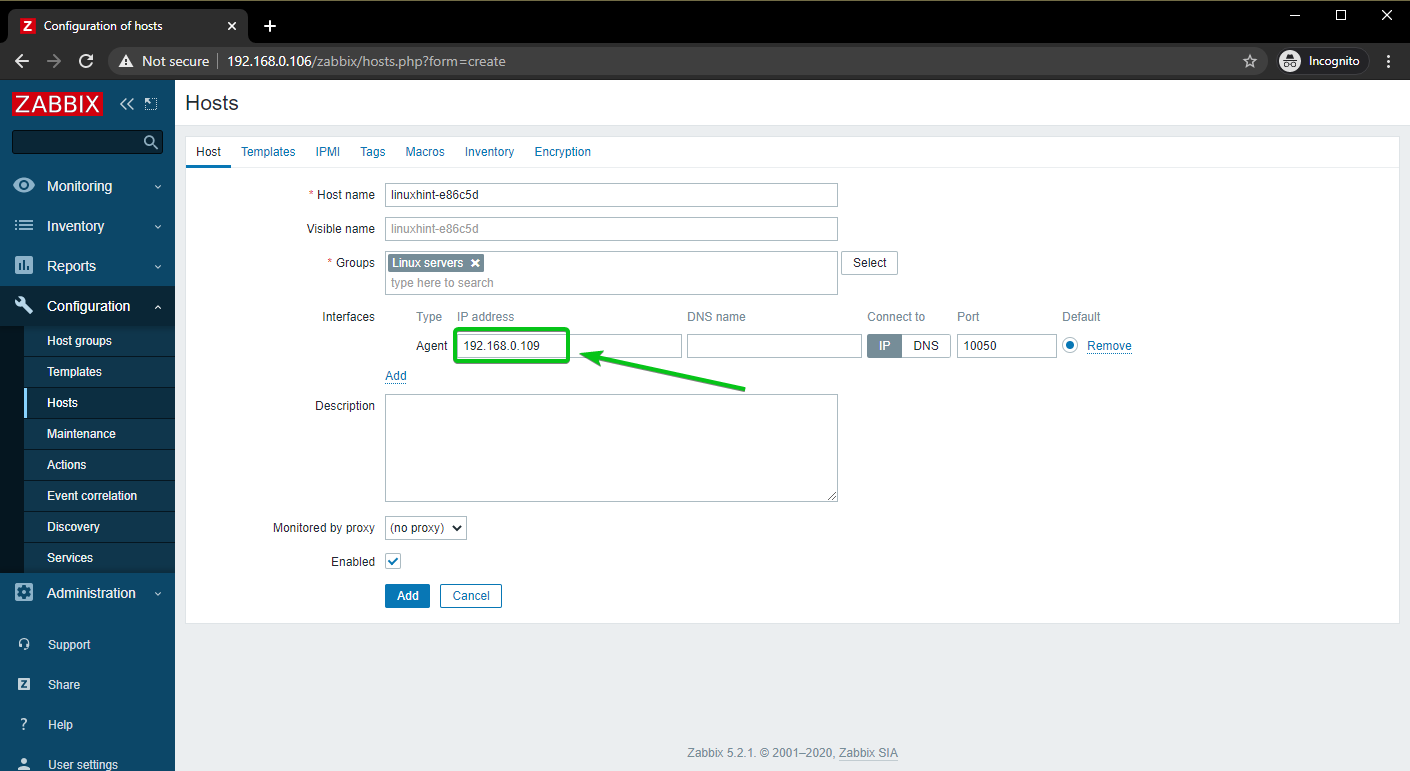
Once you’re done, click on Add.
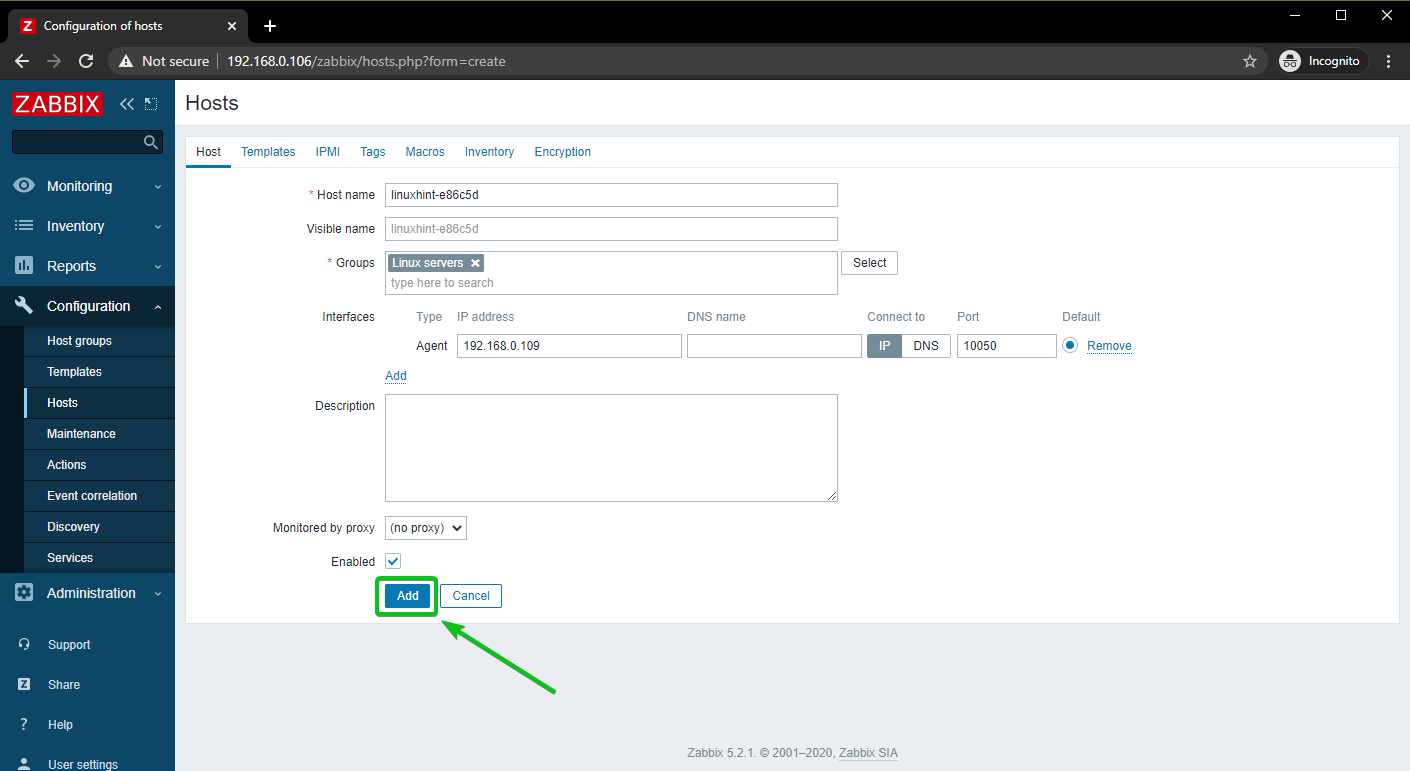
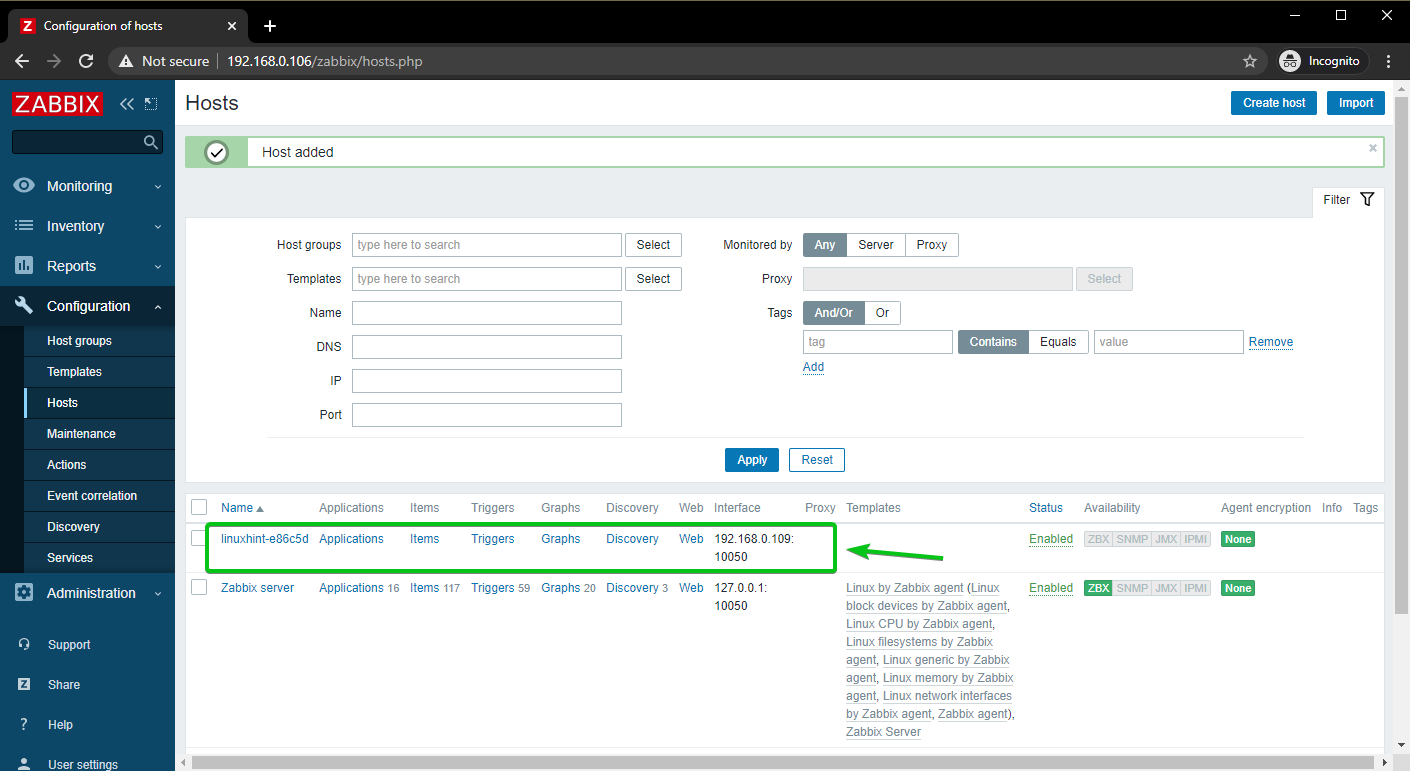
The Linux host should be added to Zabbix, as you can see in the screenshot below.
Adding a Windows 10 Host to Zabbix
In this section, I am going to show you how to add a Windows 10 host to Zabbix. So, let’s get started.
Just to keep things organized, let’s create a new host group for Windows hosts.
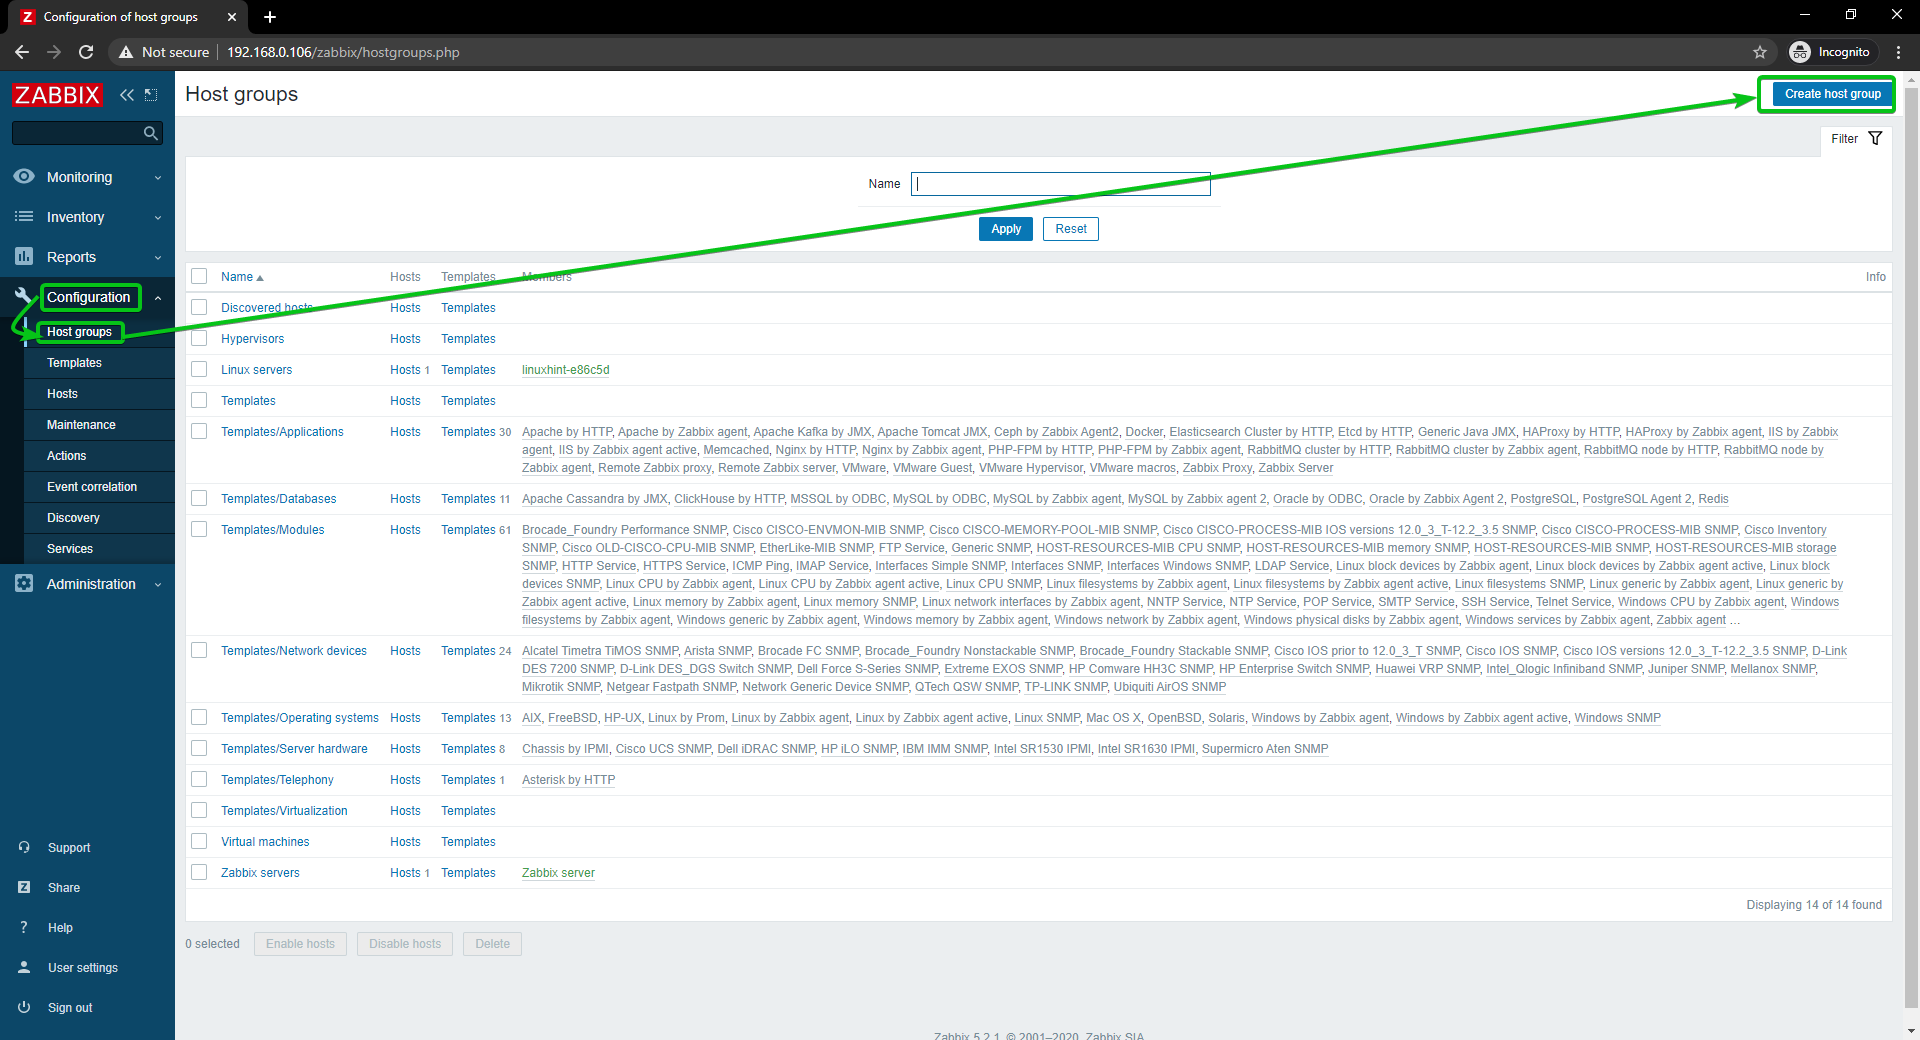
To create a host group, go to Configuration > Host groups from the Zabbix web app. Then, click on the Create host group.
Type in Windows Hosts, and click on Add.
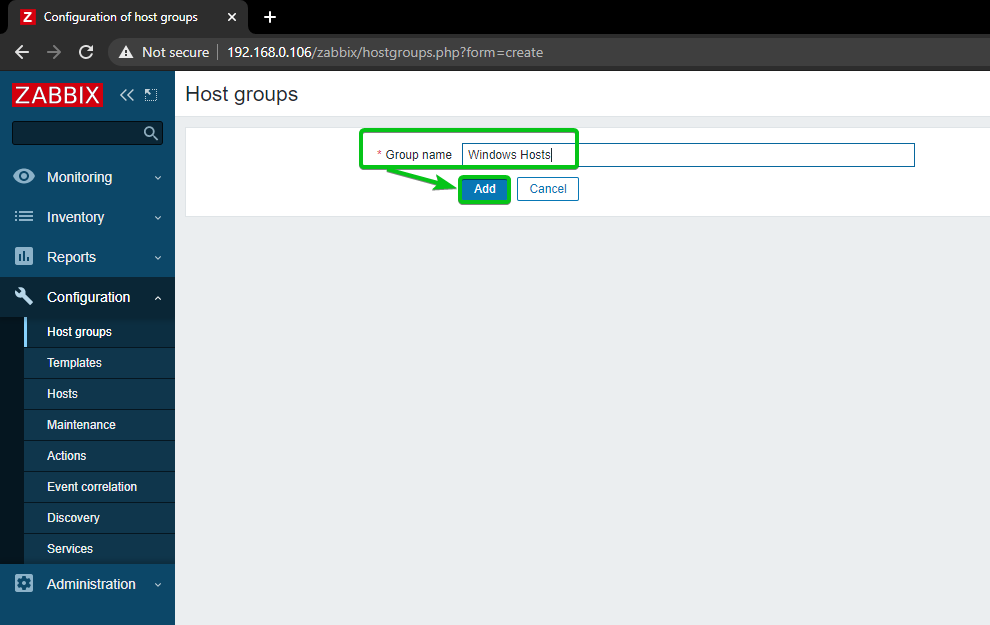
A new host group, Windows Hosts, should be added.
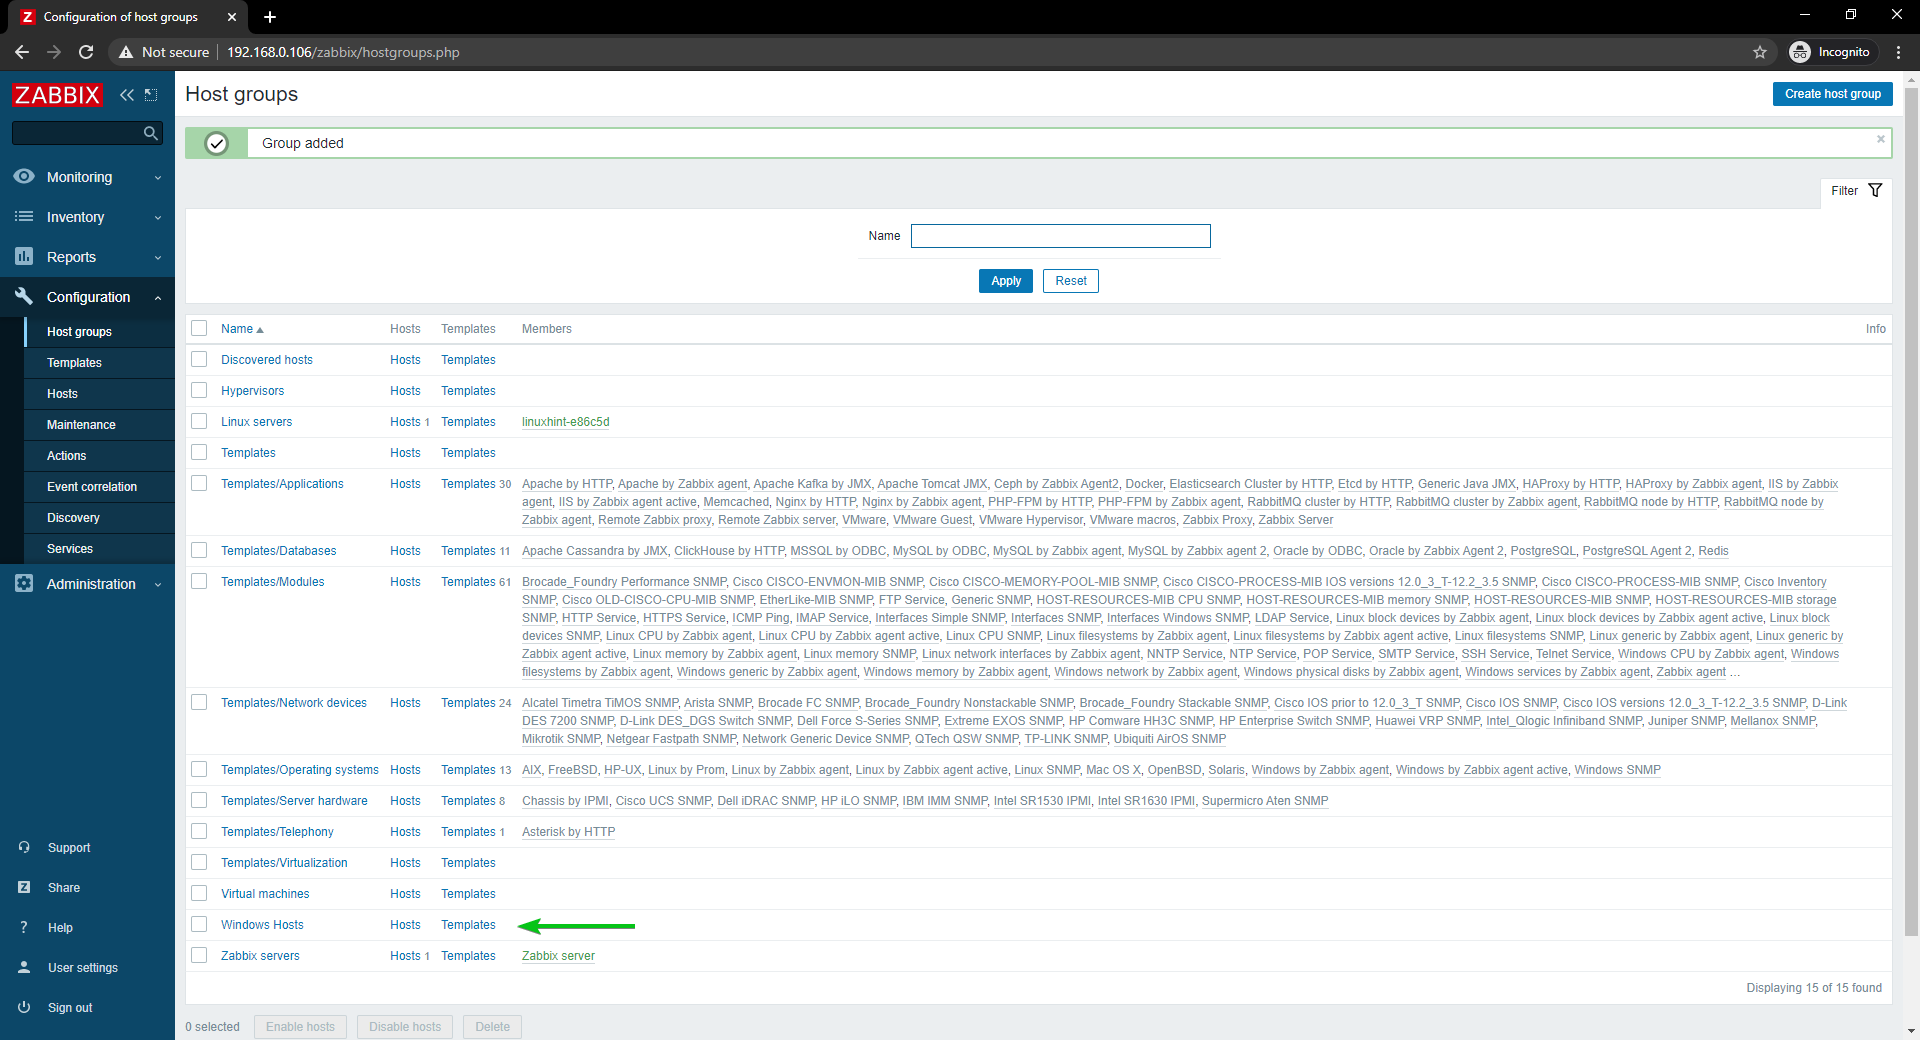
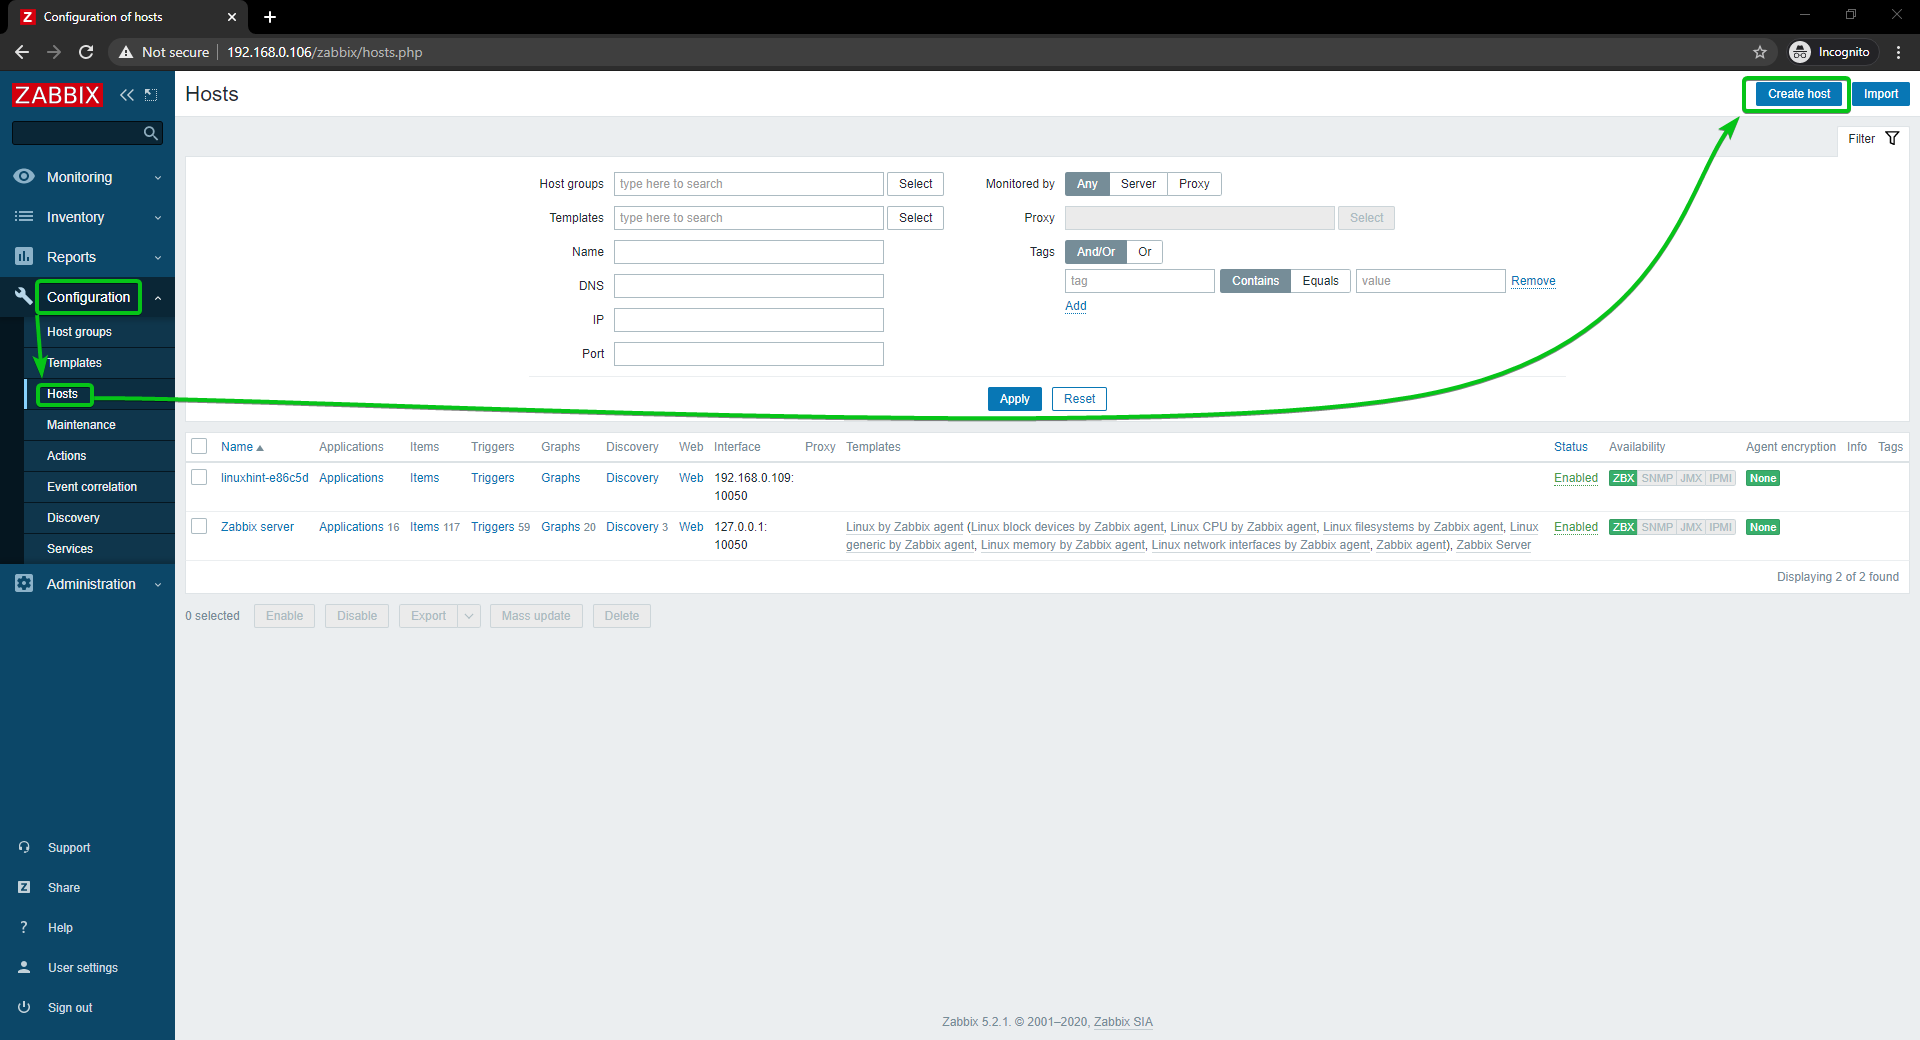
To add your Windows 10 host to Zabbix, go to Configuration > Hosts. Then, click on Create host.
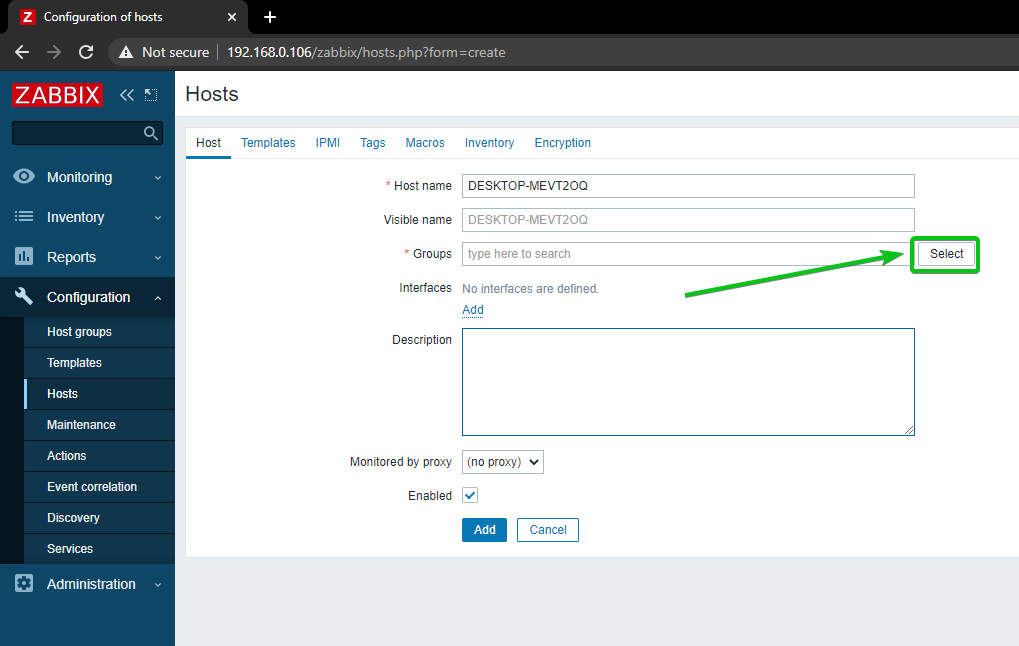
Type in the hostname or computer name of your Windows 10 host in the Host name field. Then, click on Select, as marked in the screenshot below.
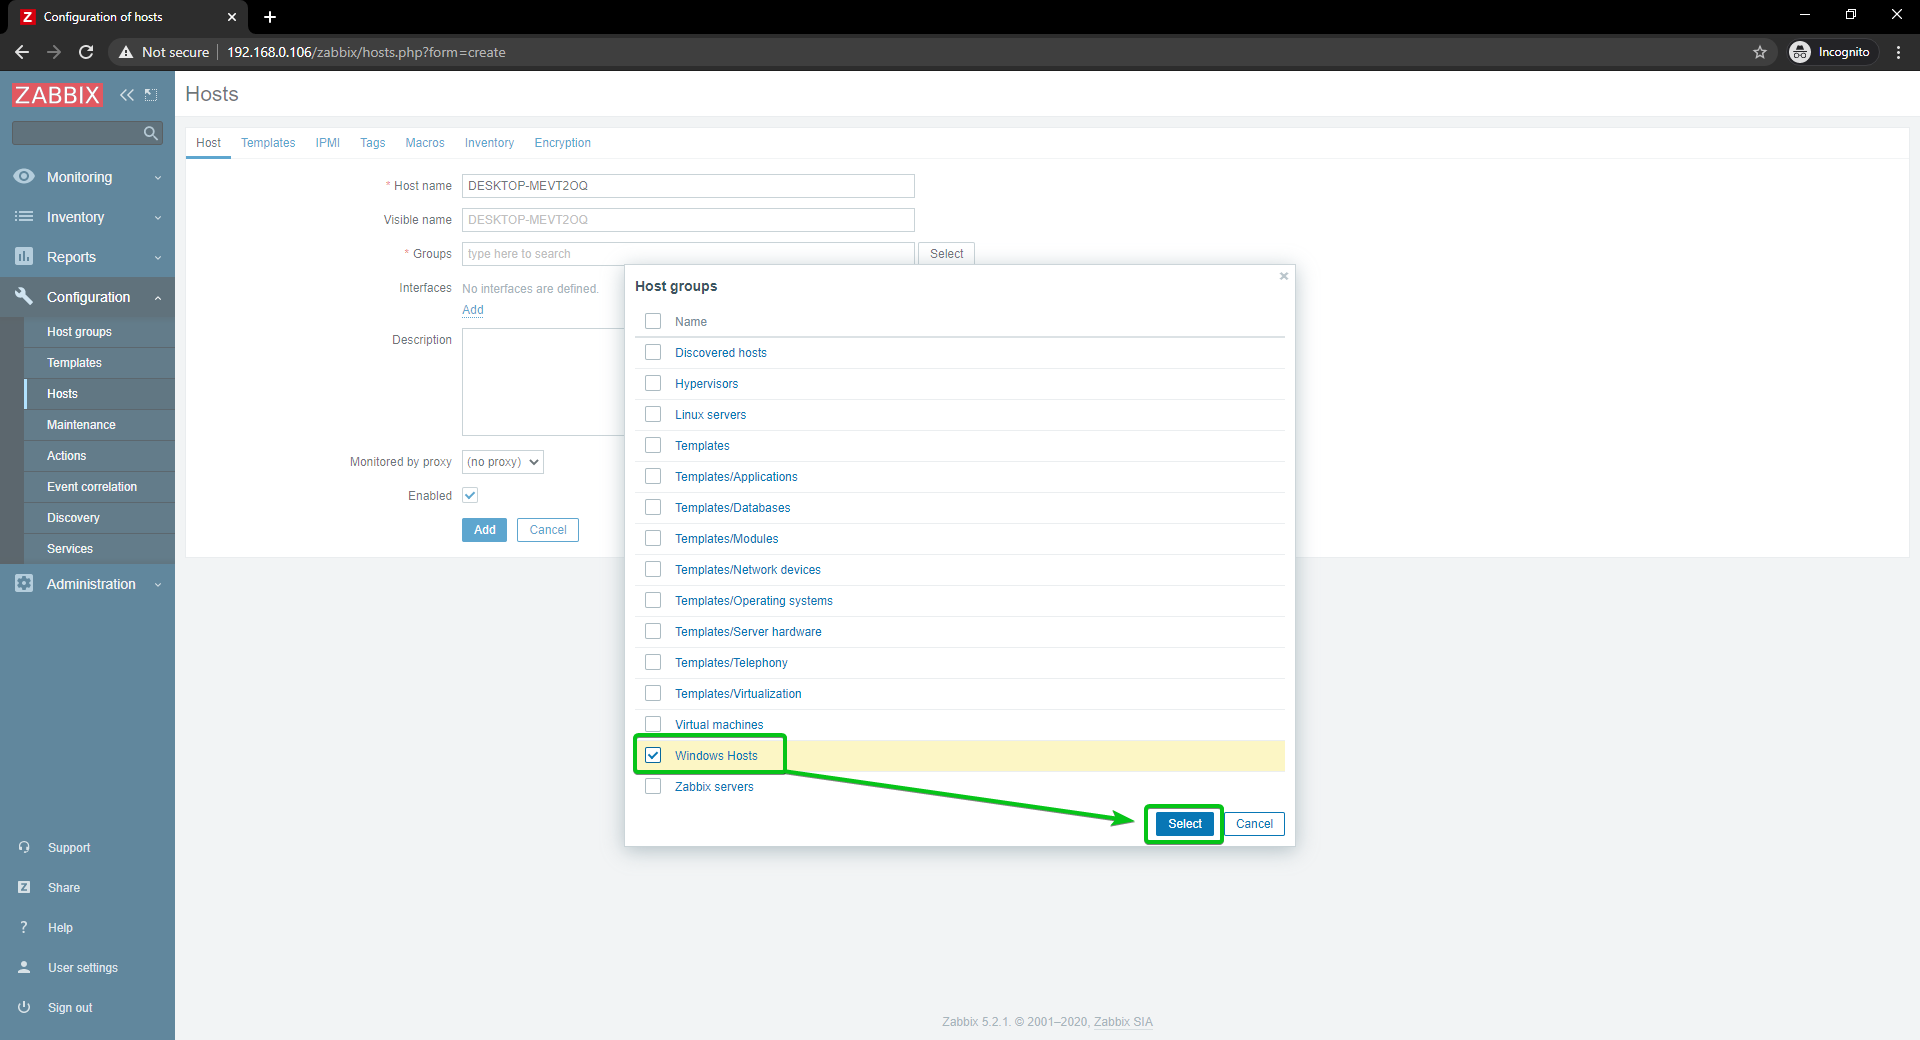
Check the newly created group Windows Hosts, and click on Select.
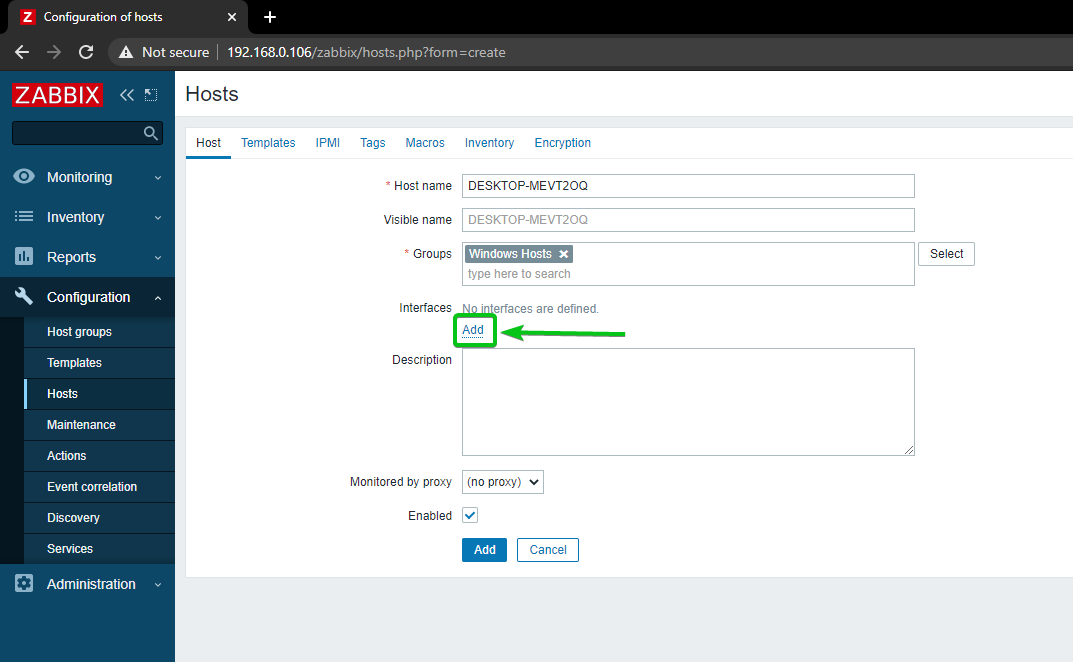
Click on Add, as marked in the screenshot below.
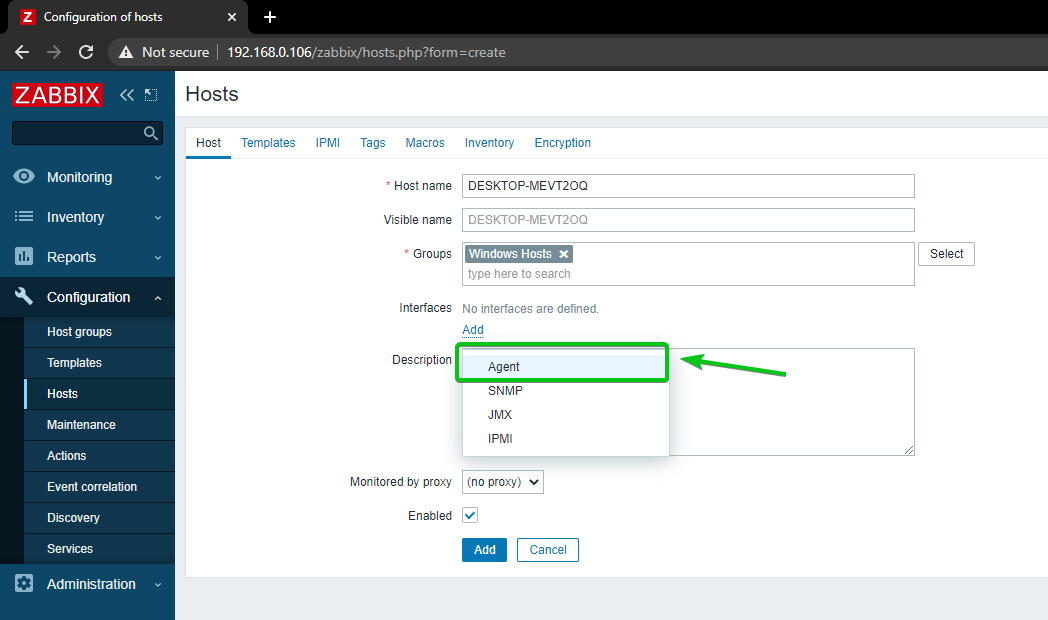
Click on Agent.
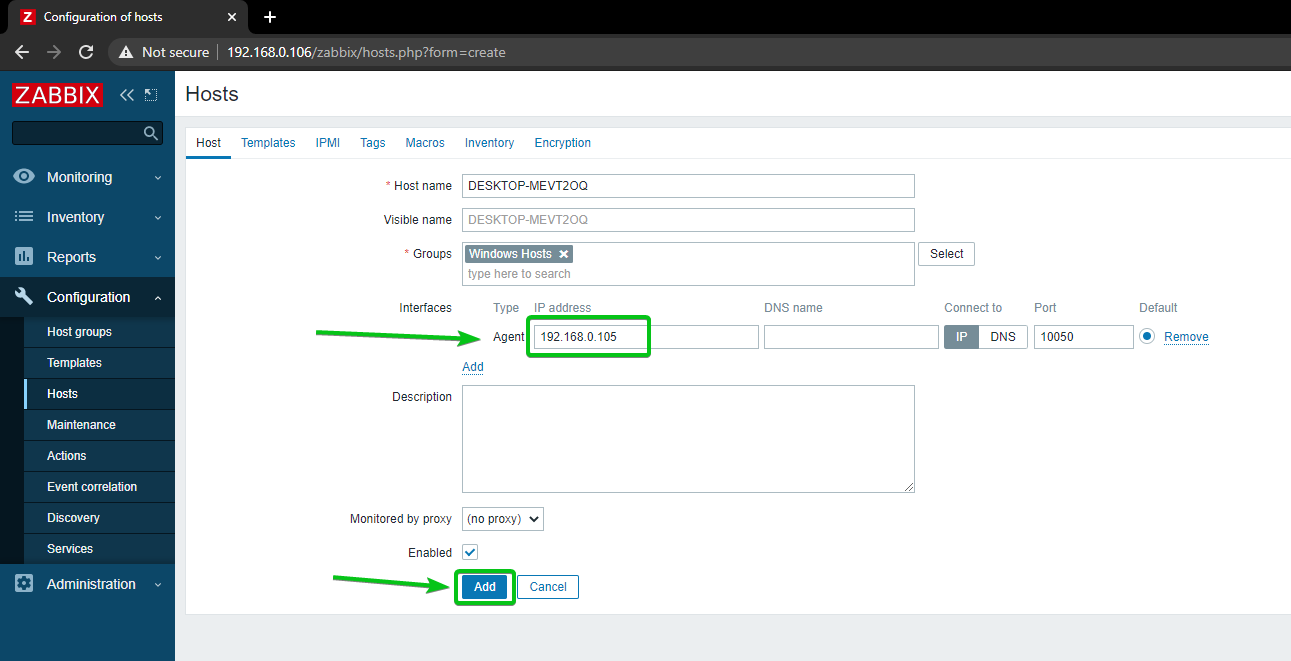
Type in the IP address of your Windows 10 host, and click on Add.
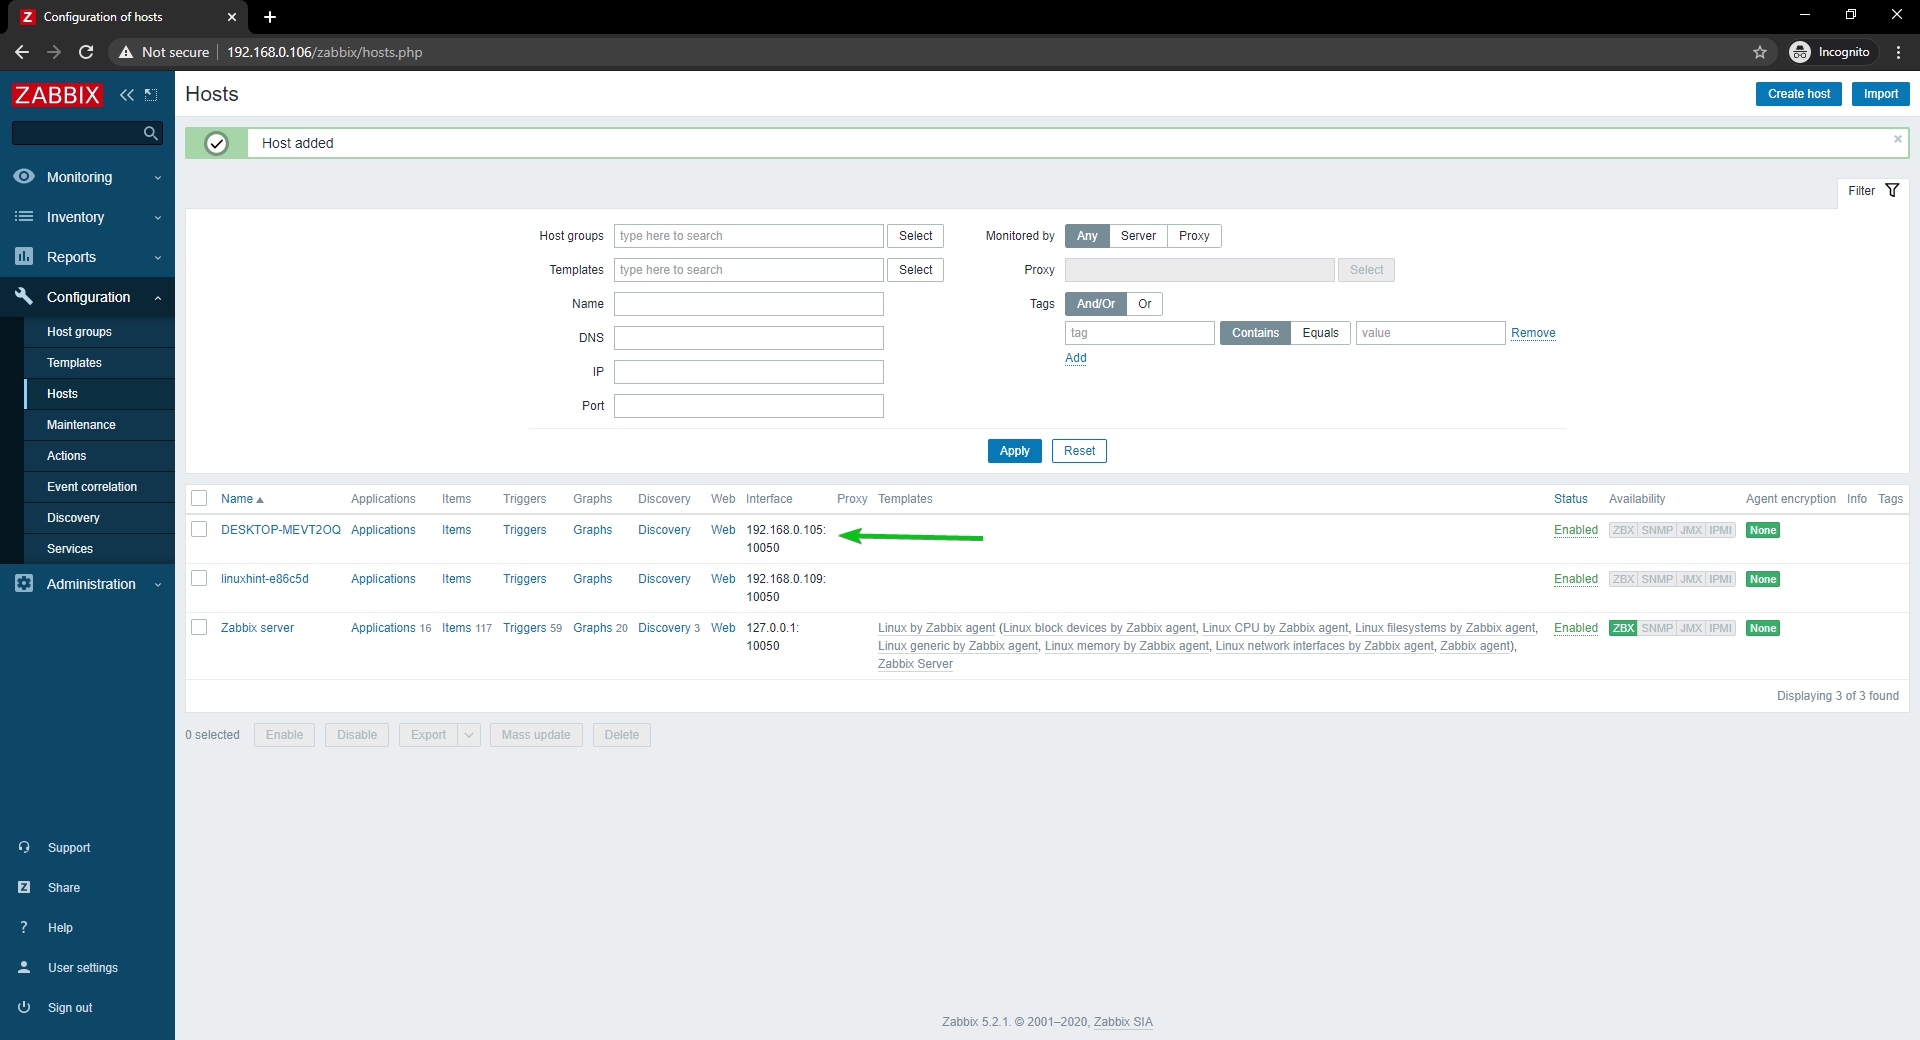
Your Windows 10 host should be added to Zabbix.
Monitoring Network Usage of Linux Hosts
In this section, I am going to show you how to monitor the network usage of Linux Hosts using Zabbix 5. So, let’s get started.
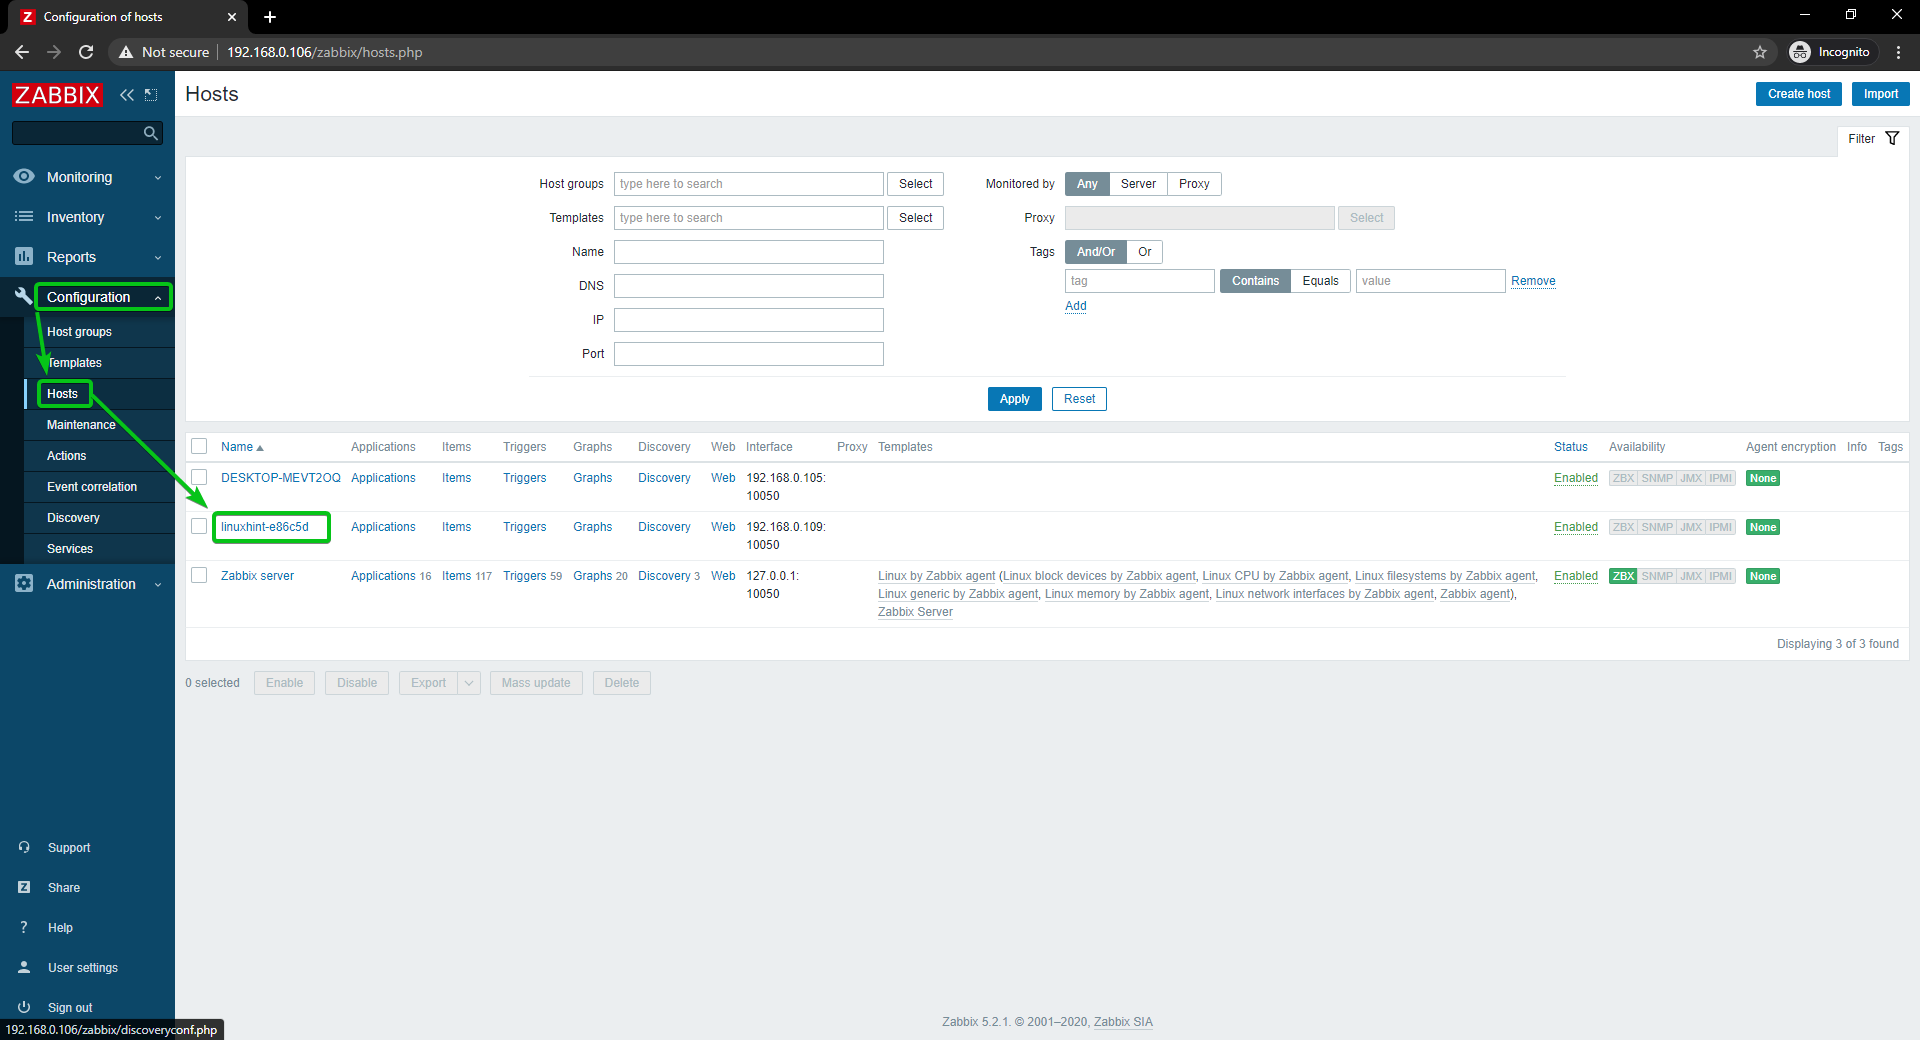
First, navigate to Configuration > Hosts and click on the Linux Host that you want to monitor network usage.
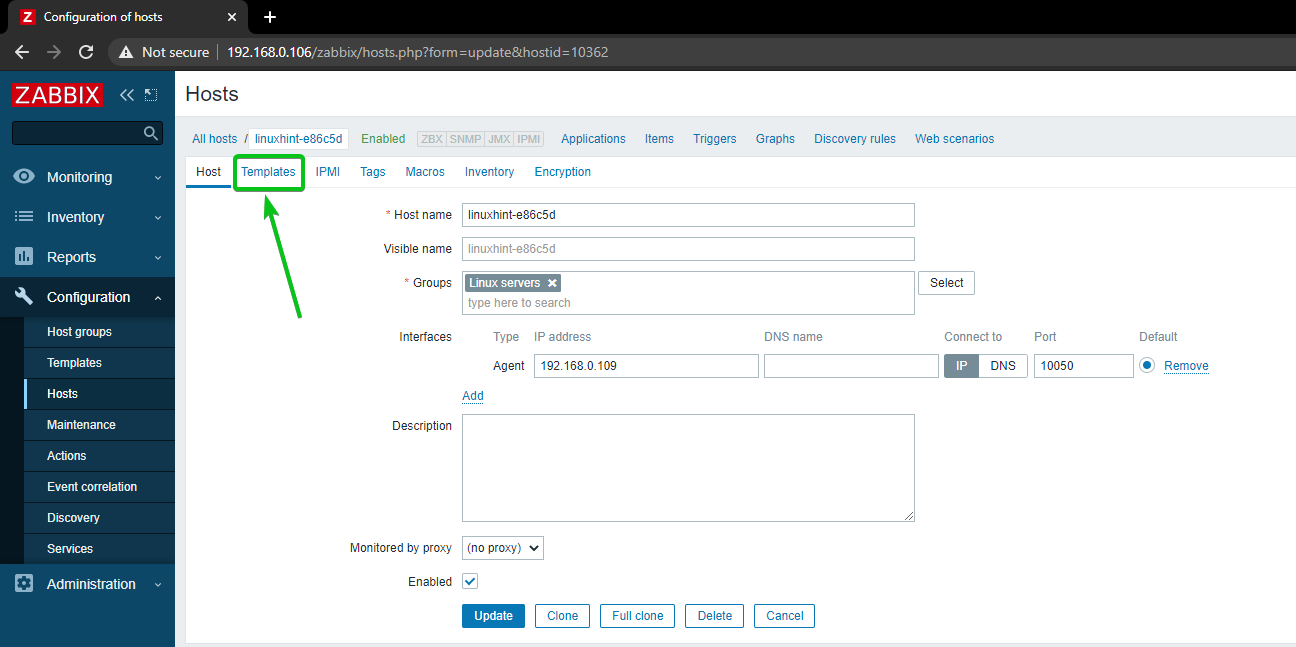
Click on Templates.
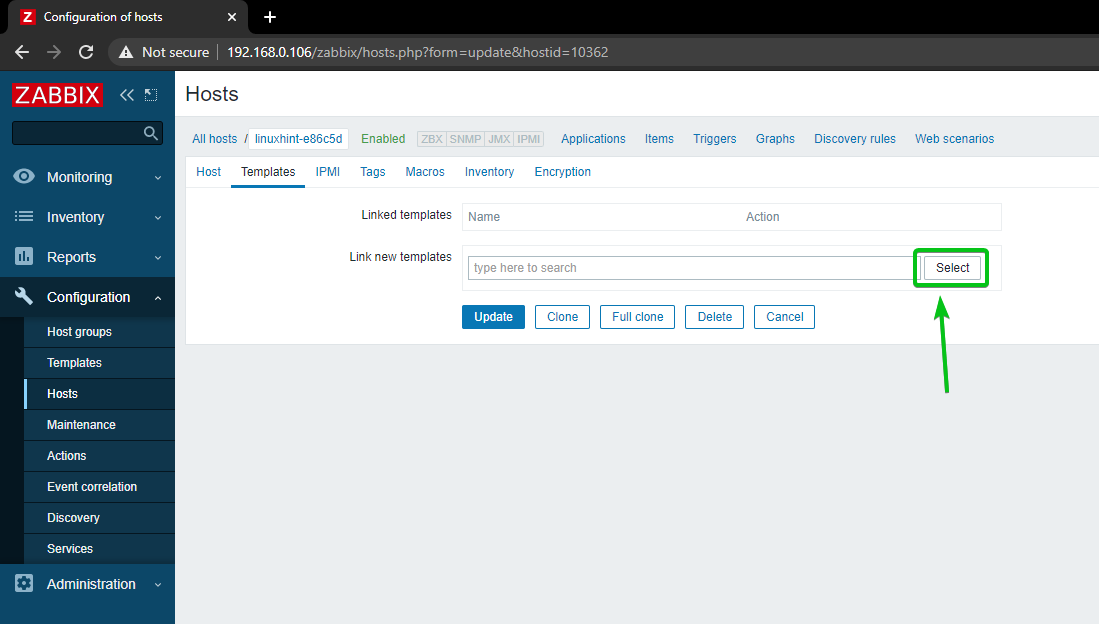
Click on Select, as marked in the screenshot below.
Click on Select, as marked in the screenshot below.
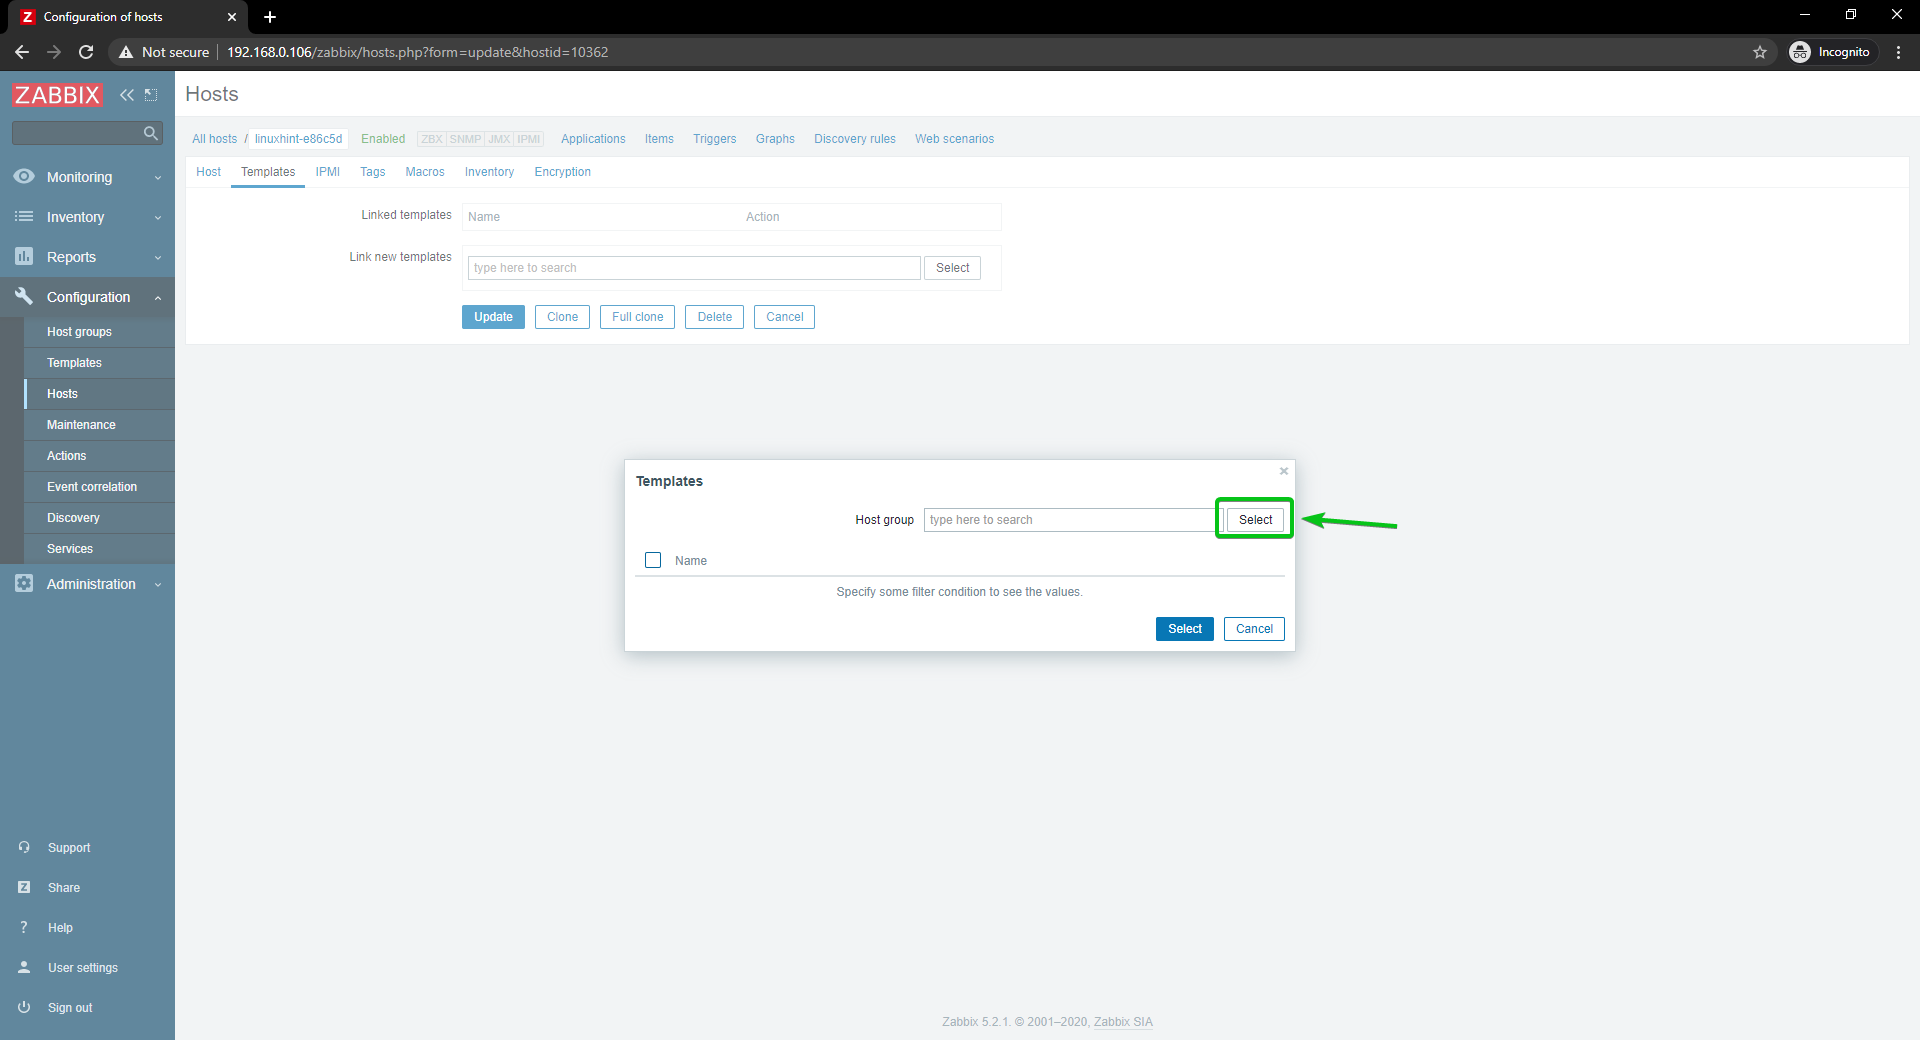
Click on Templates, as marked in the screenshot below.
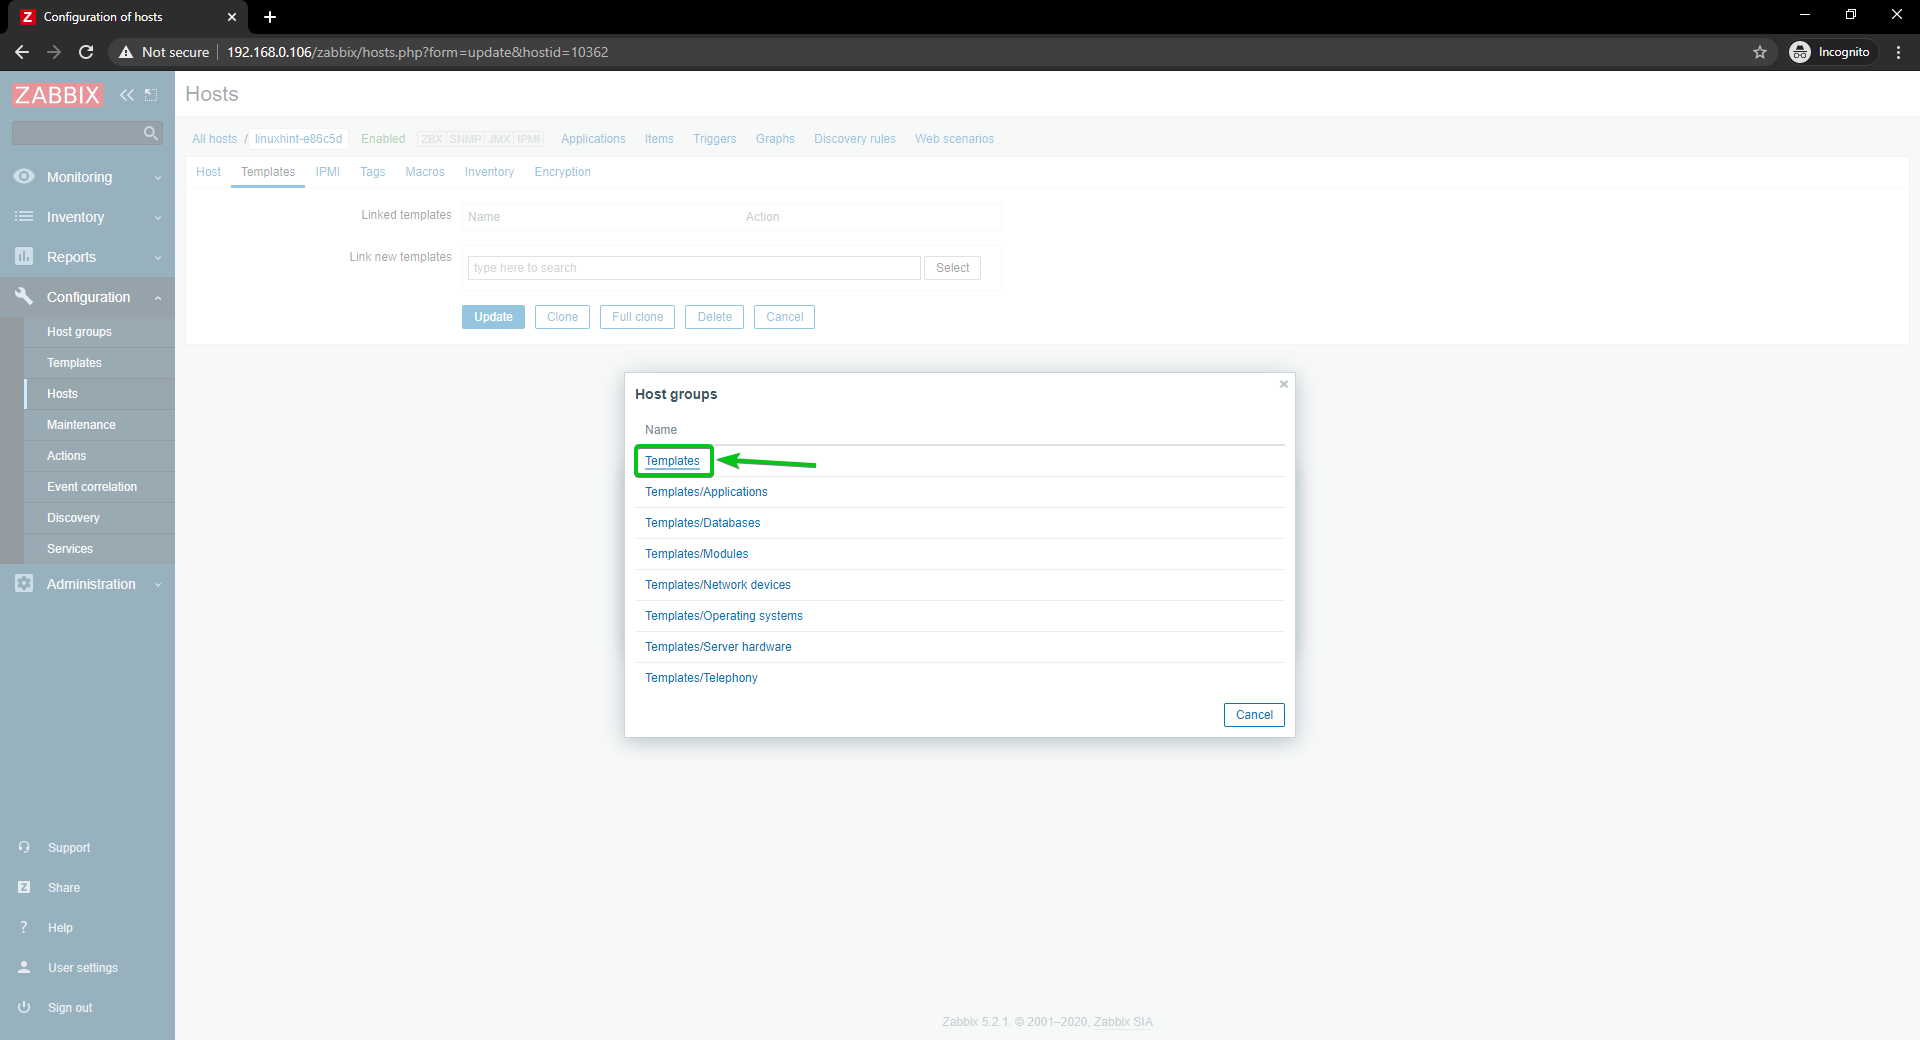
Check Linux network interfaces by Zabbix agent checkbox, and click on Select.
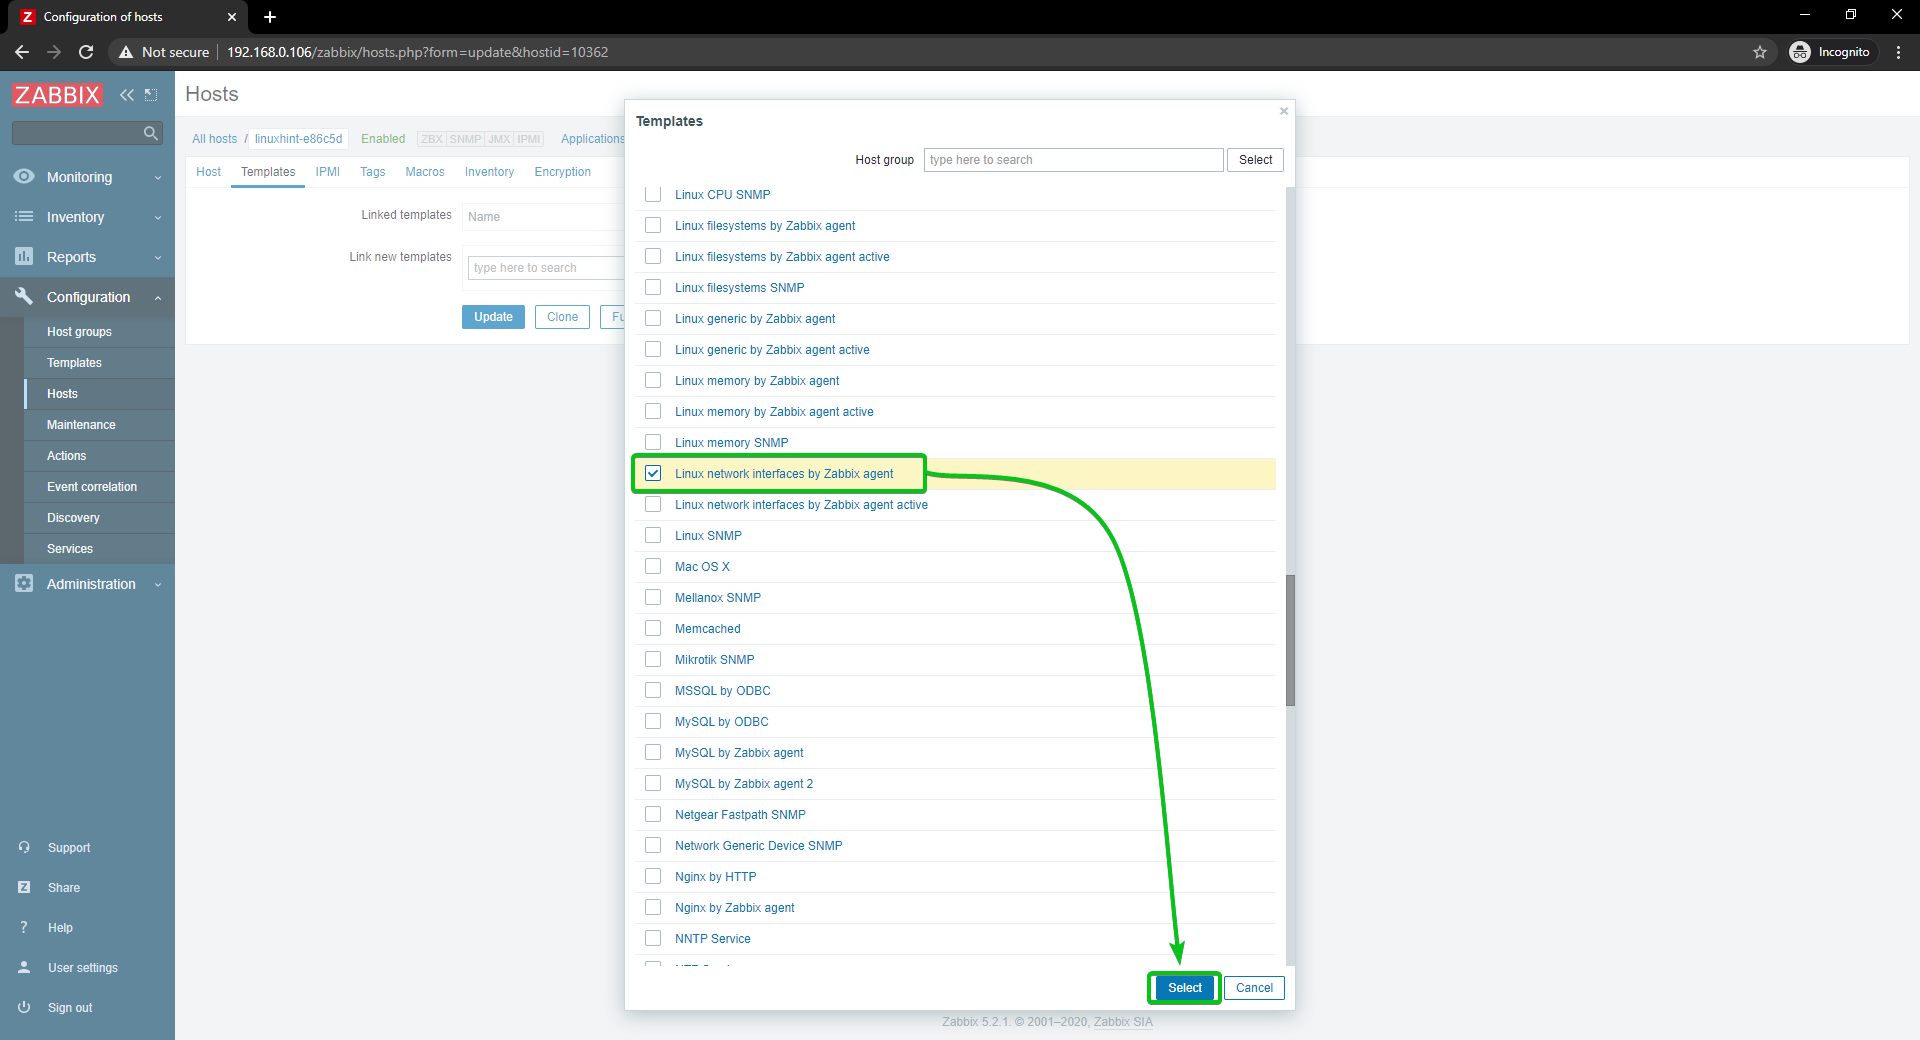
Click on Update.
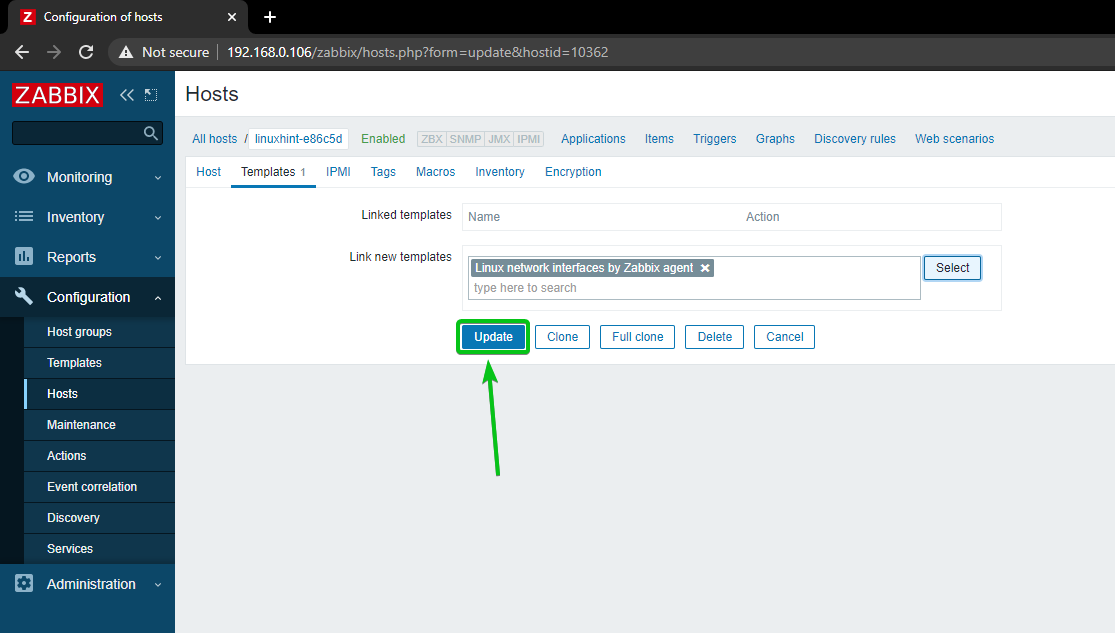
The Linux host should be updated.
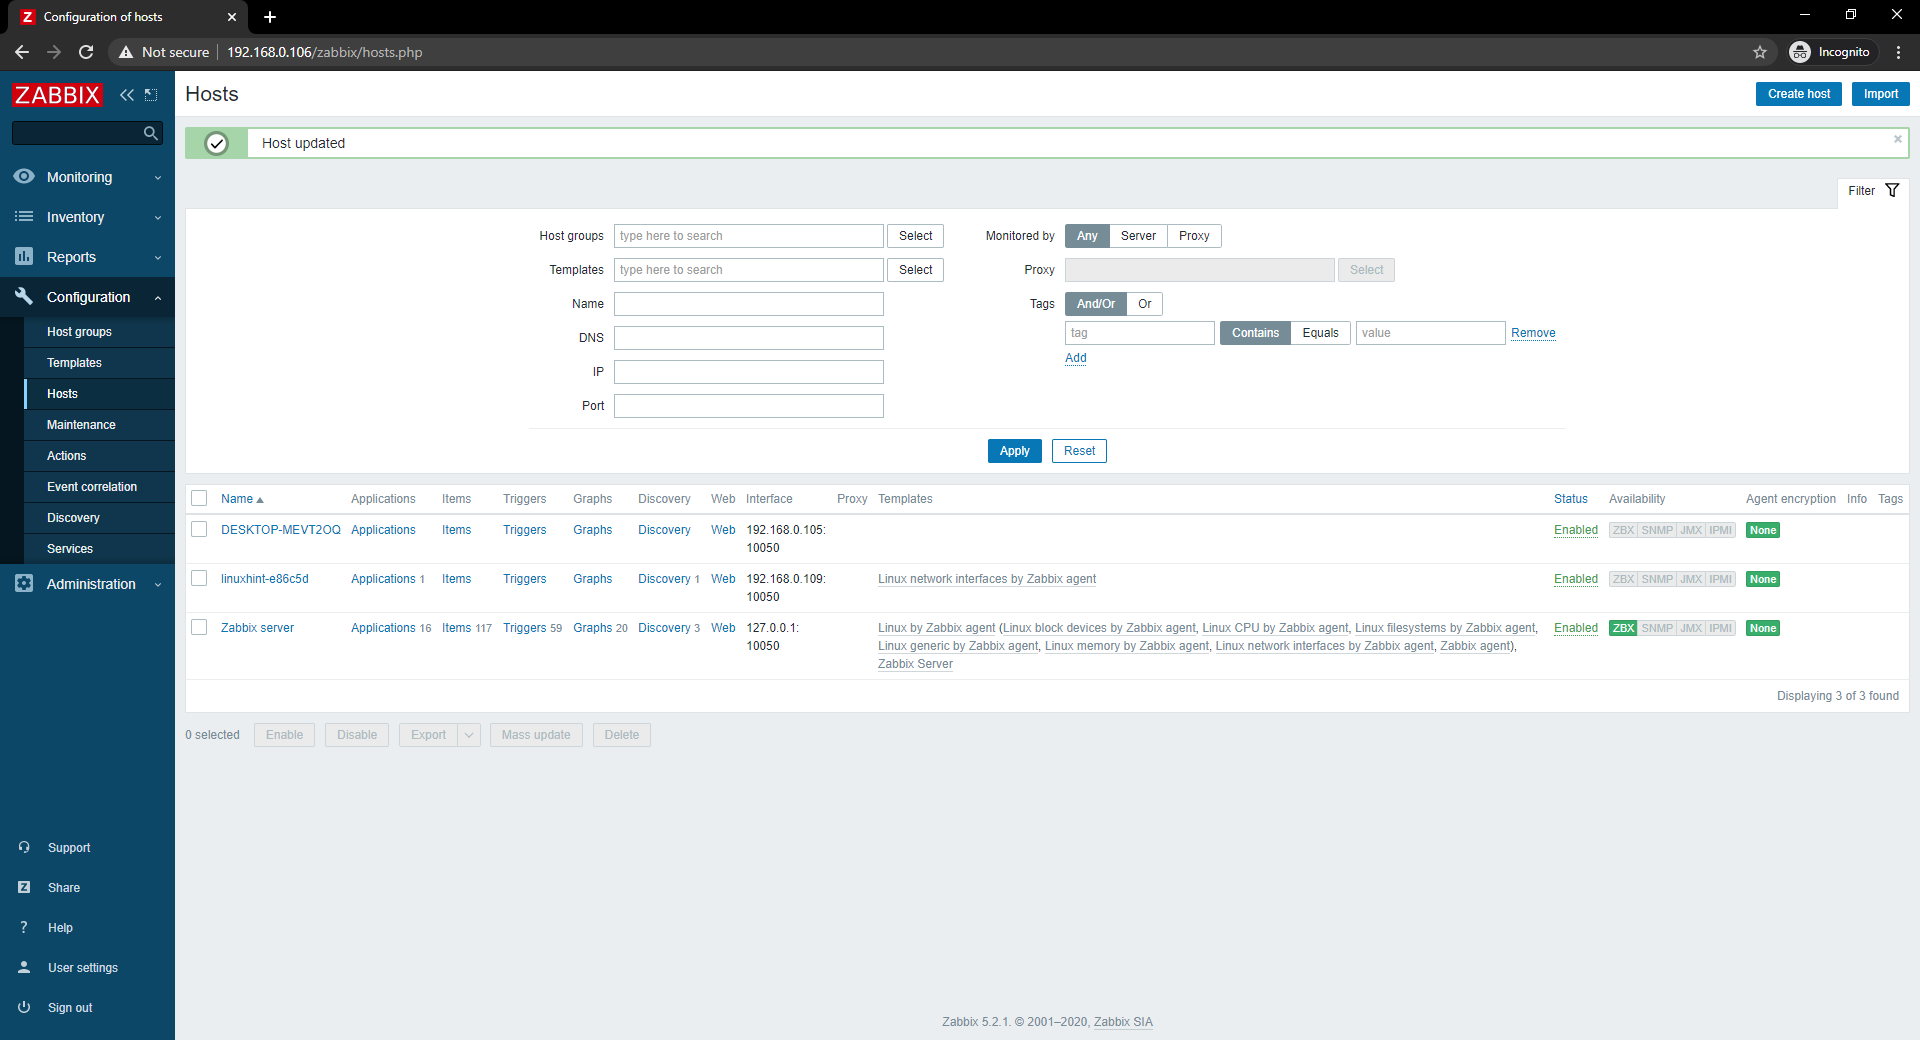
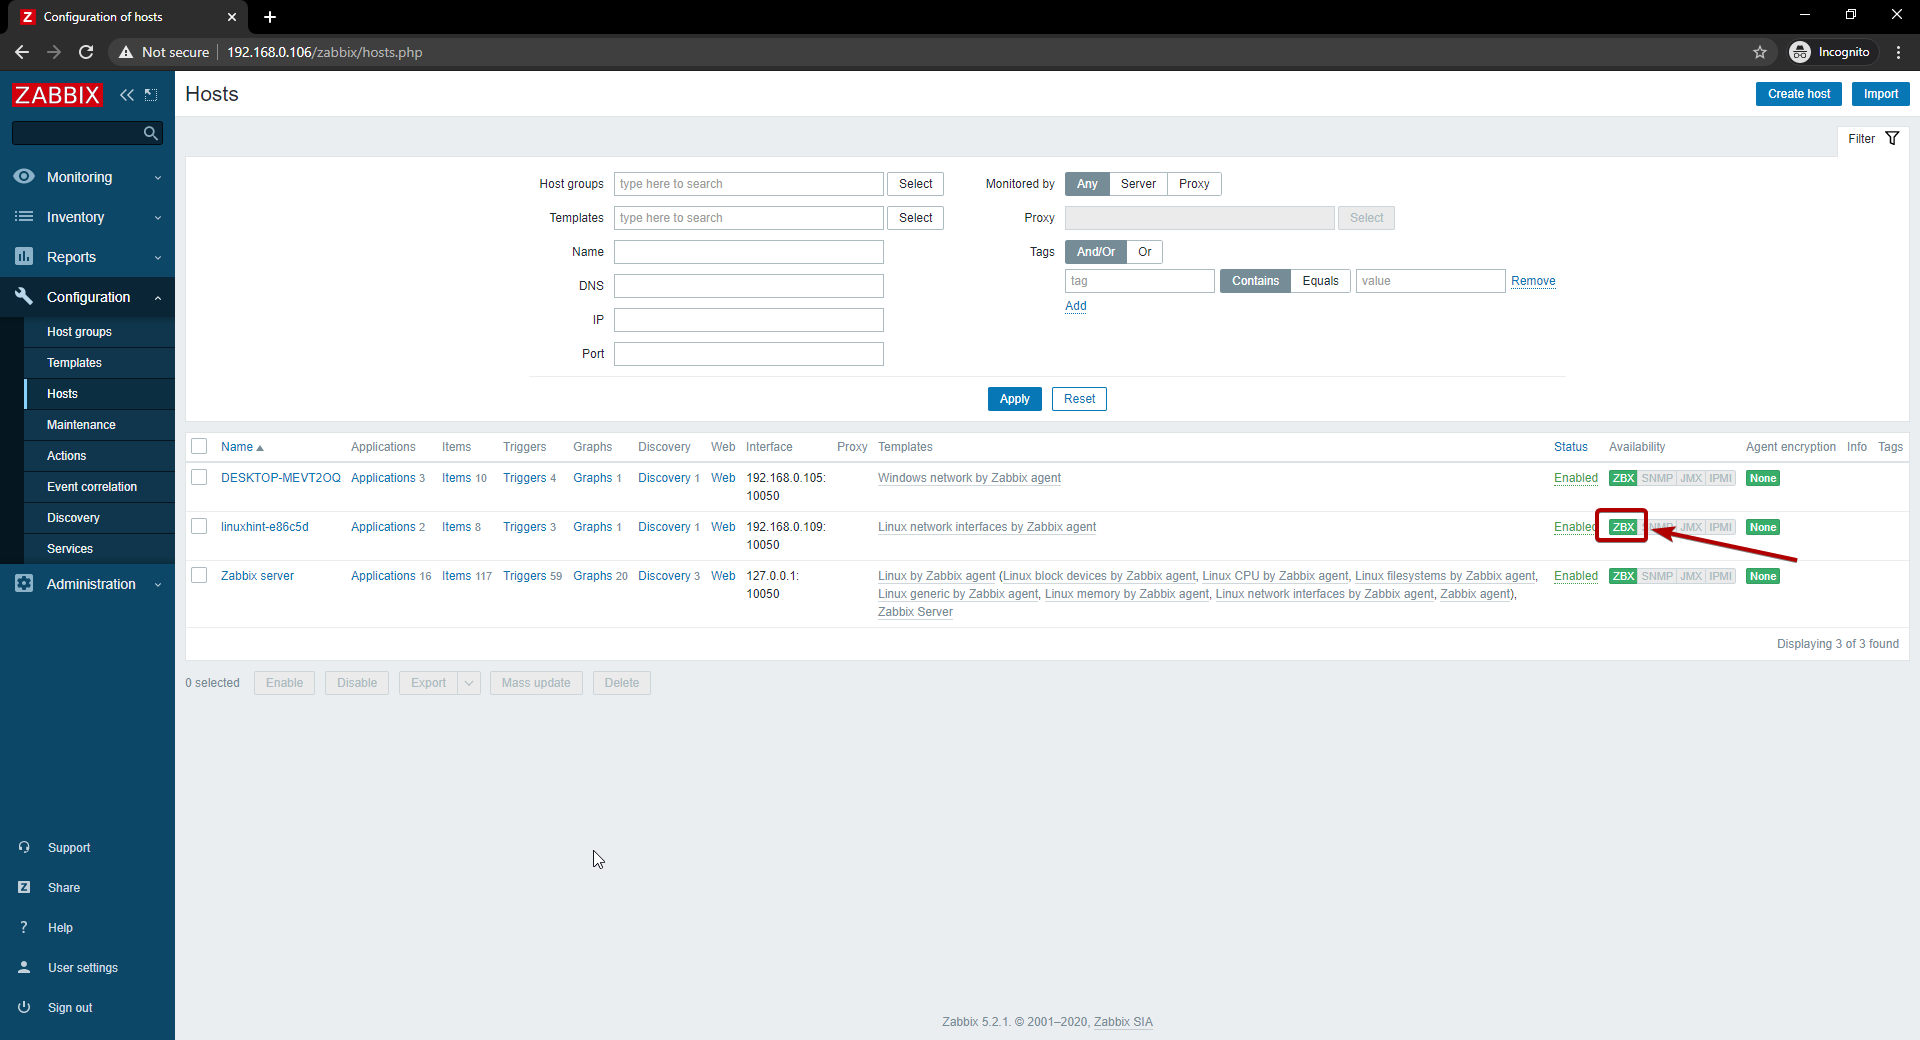
After a while, the ZBX availability option should be highlighted, as you can see in the screenshot below.
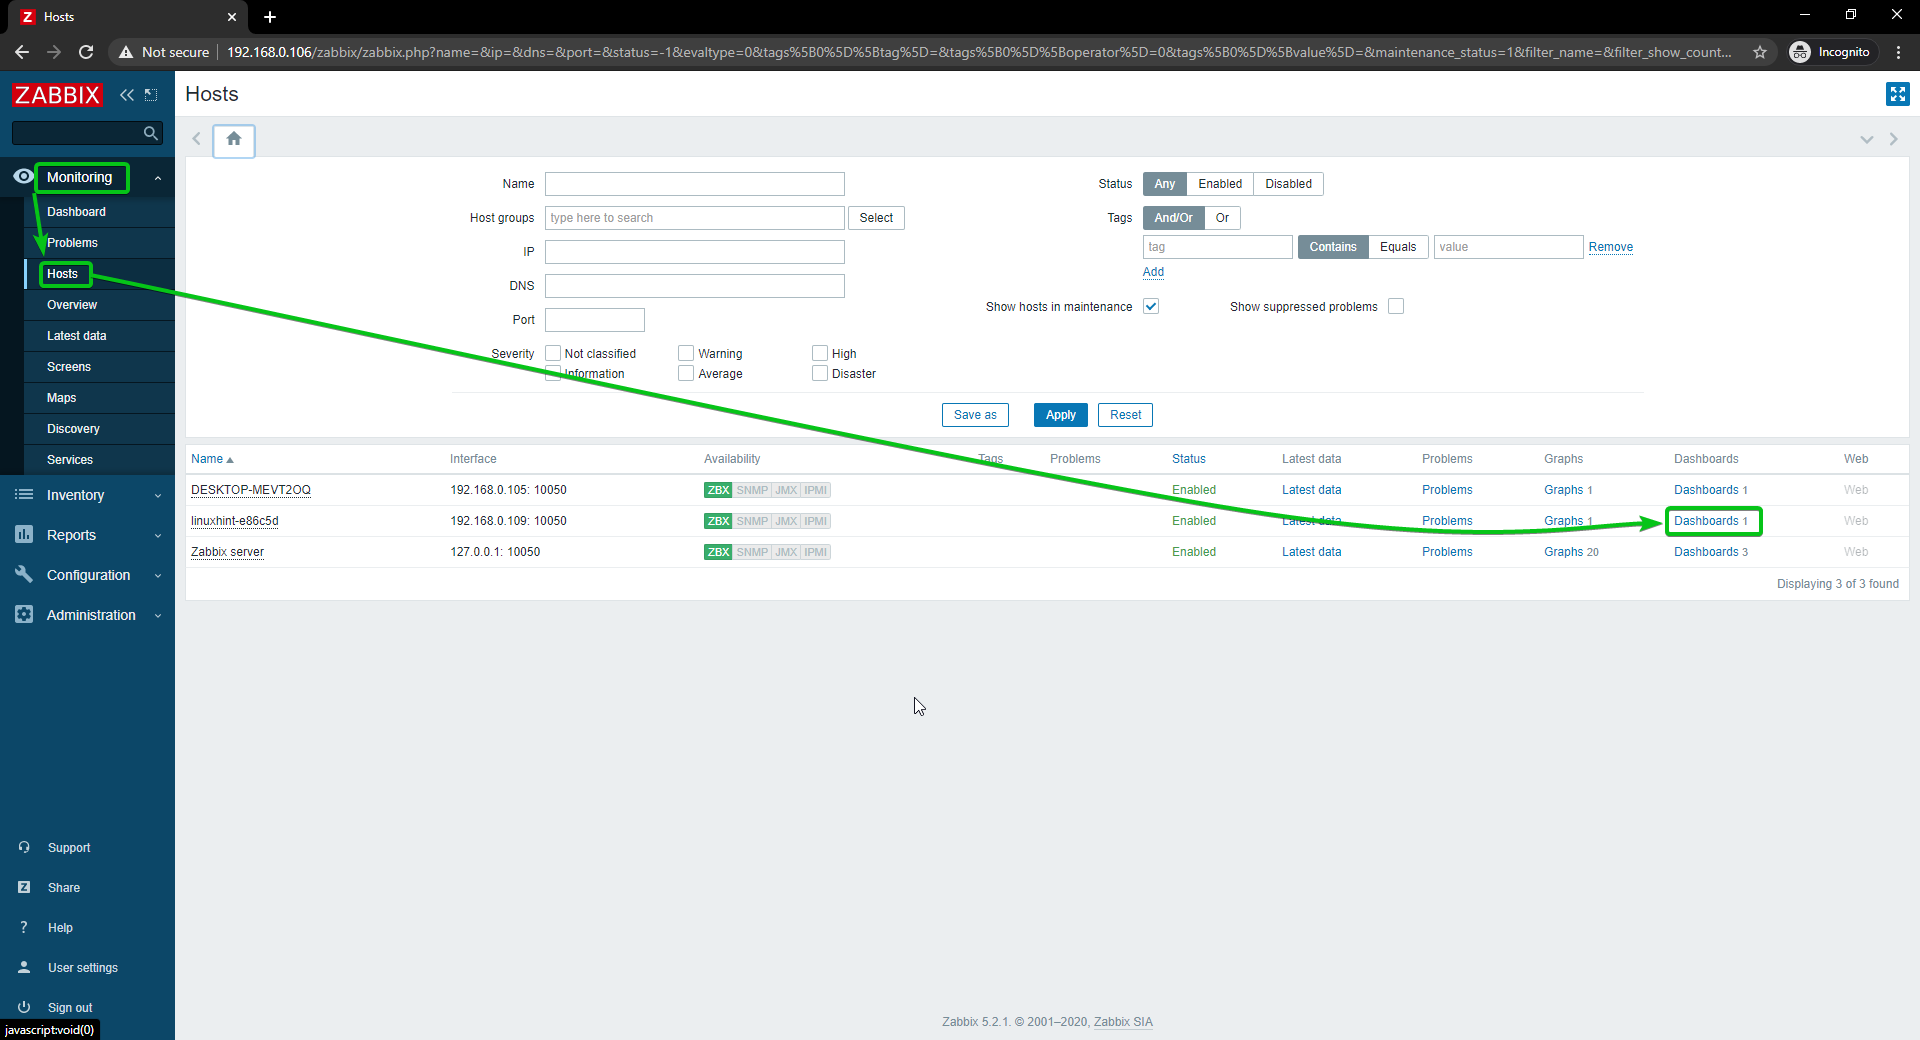
When the ZBX option is highlighted, navigate to Monitoring > Hosts and click on the Dashboards link of your Linux host, as you can see in the screenshot below.
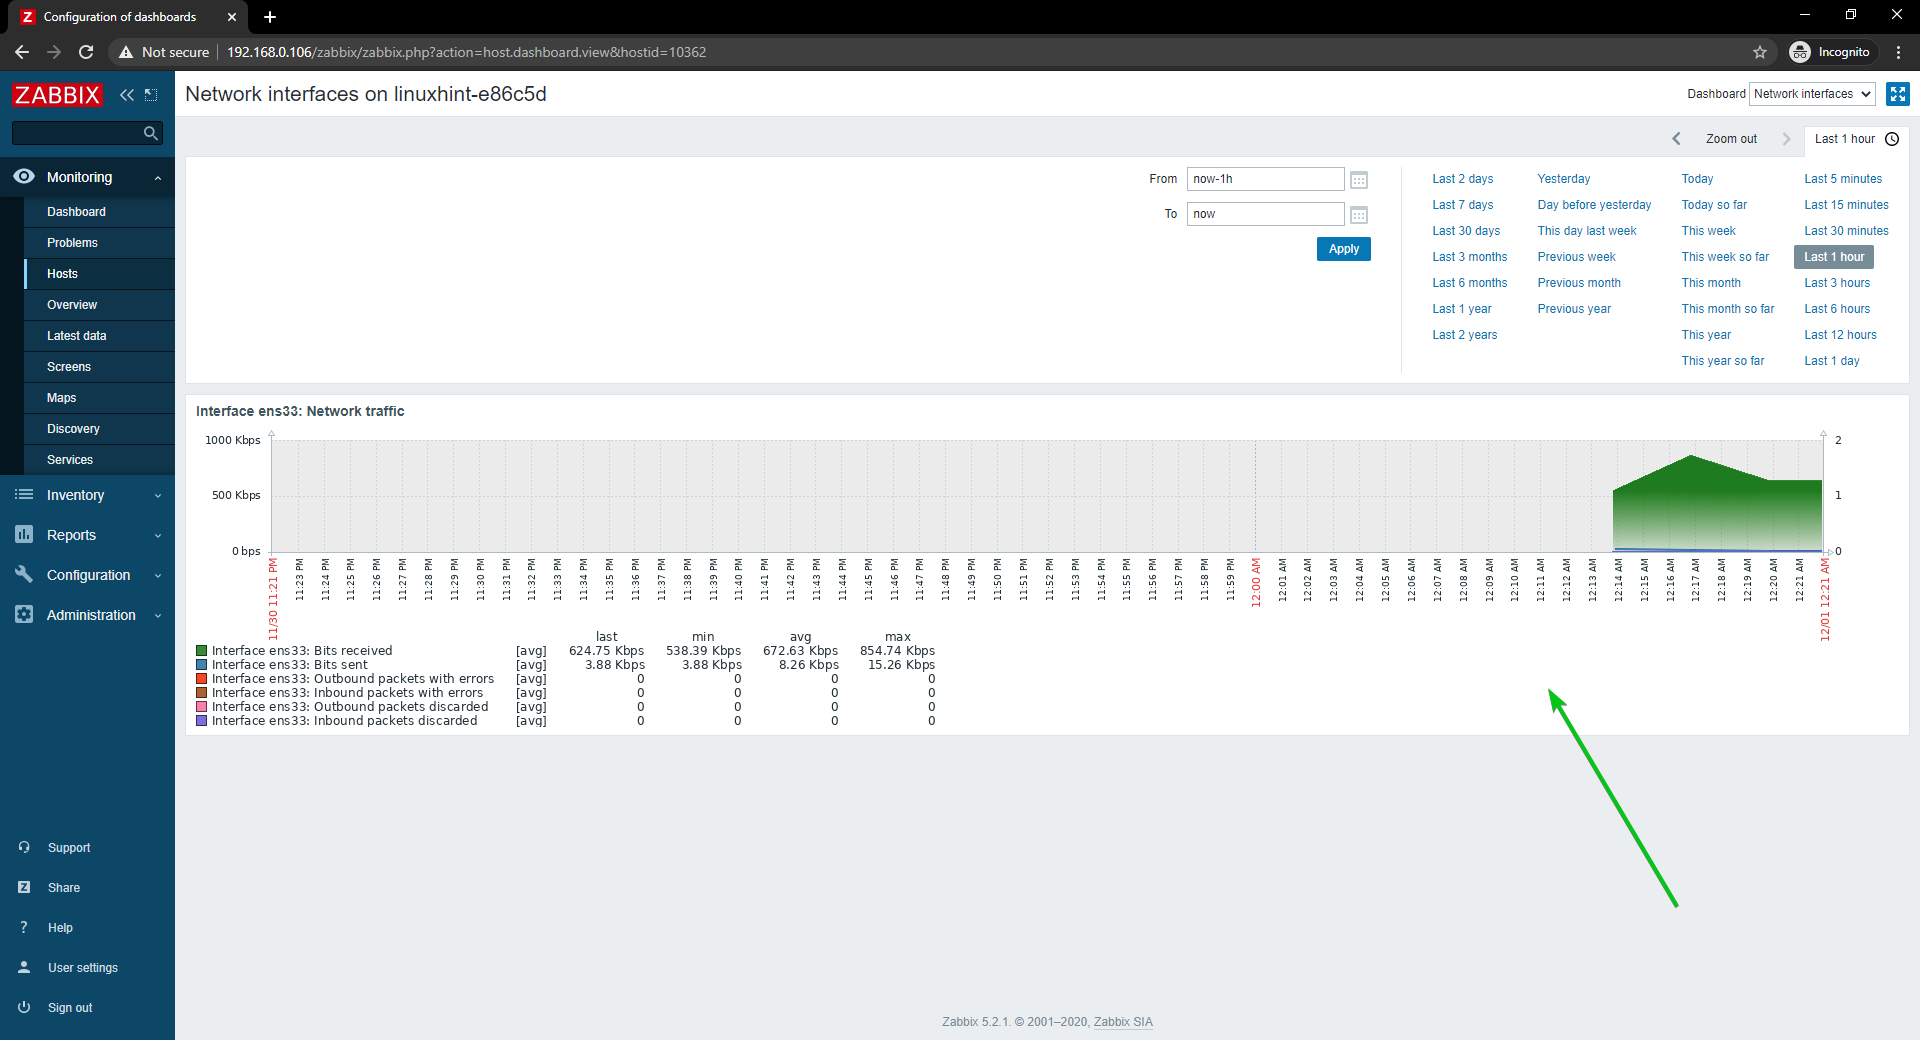
As you can see, the network usage graph is being displayed.
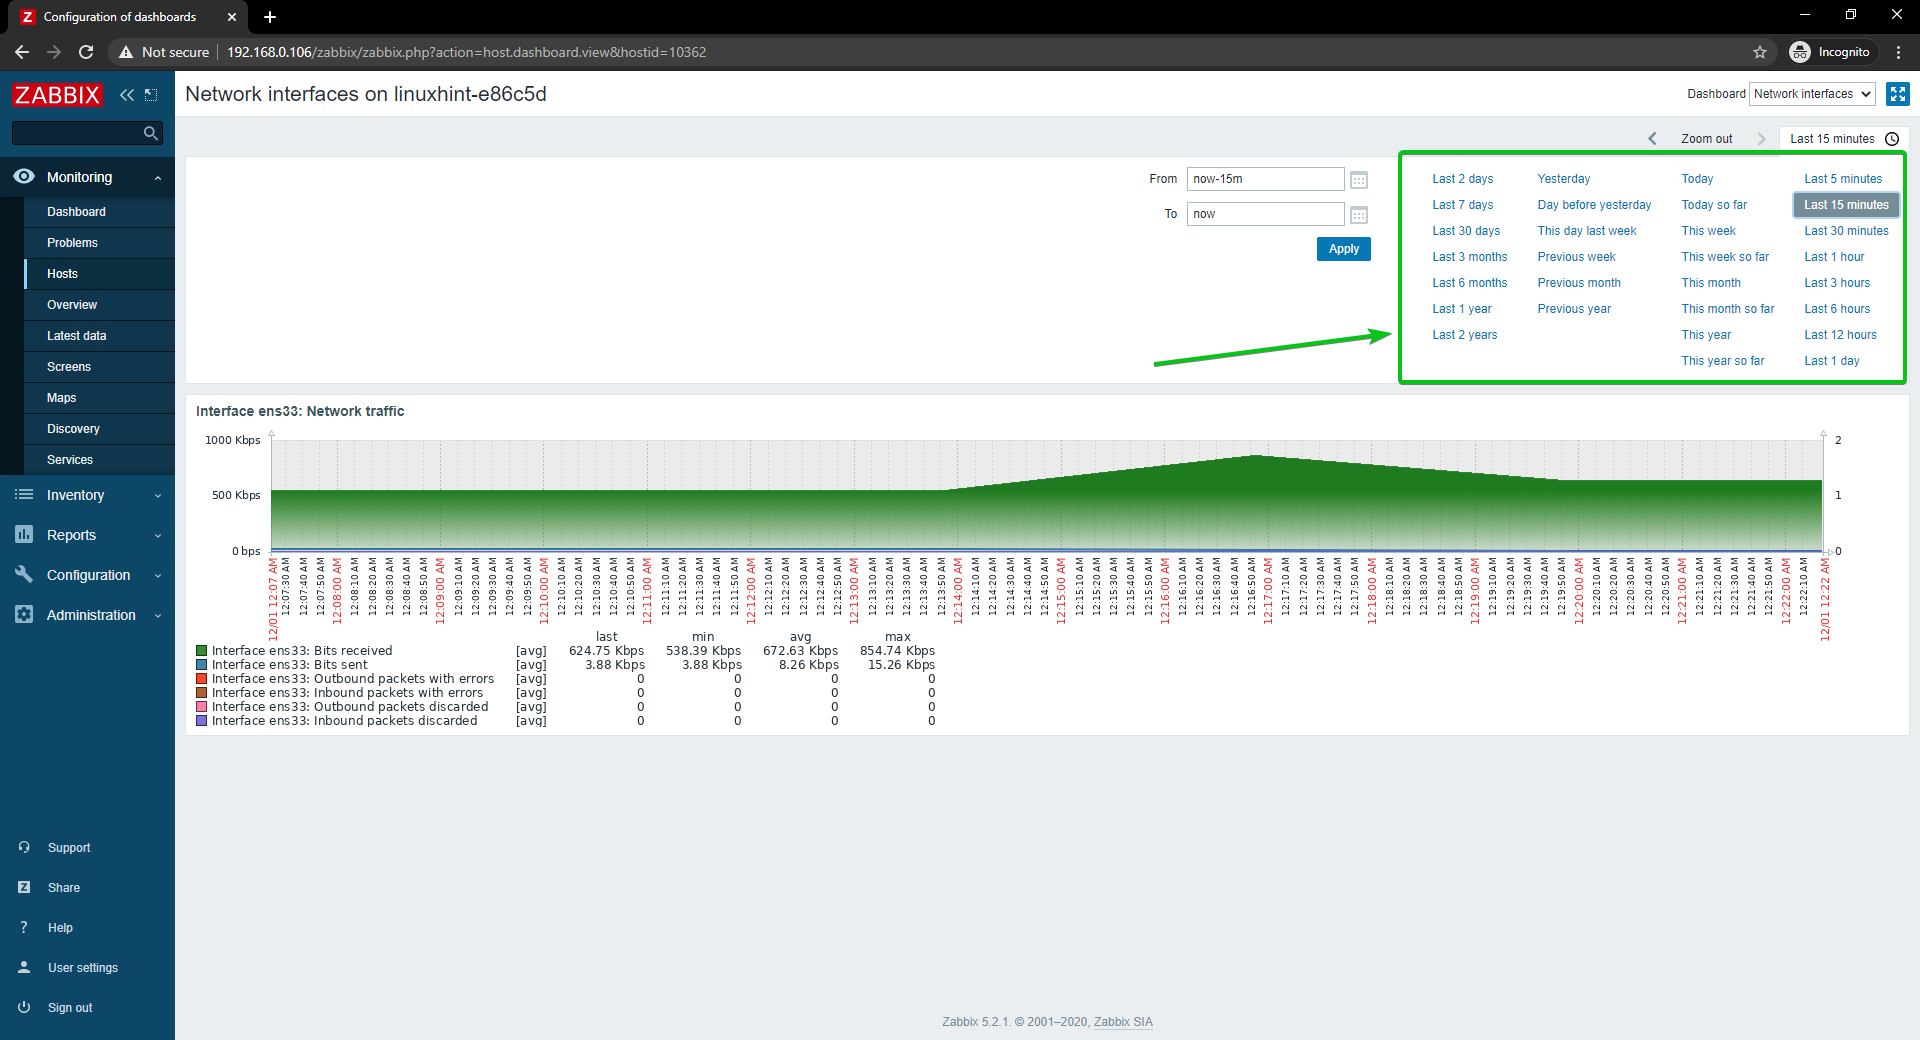
You can change the timeline of the graph as well. As you can see, I have changed the graph time to the Last 15 minutes. The graph is being displayed nicely.
This is how you monitor the network usage of a Linux host using Zabbix on your Raspberry Pi.
Monitoring Network Usage of Windows Hosts
In this section, I am going to show you how to monitor the network usage of Windows 10 Hosts using Zabbix 5. So, let’s get started.
First, navigate to Configuration > Hosts and click on the Windows 10 Host that you want to monitor network usage.
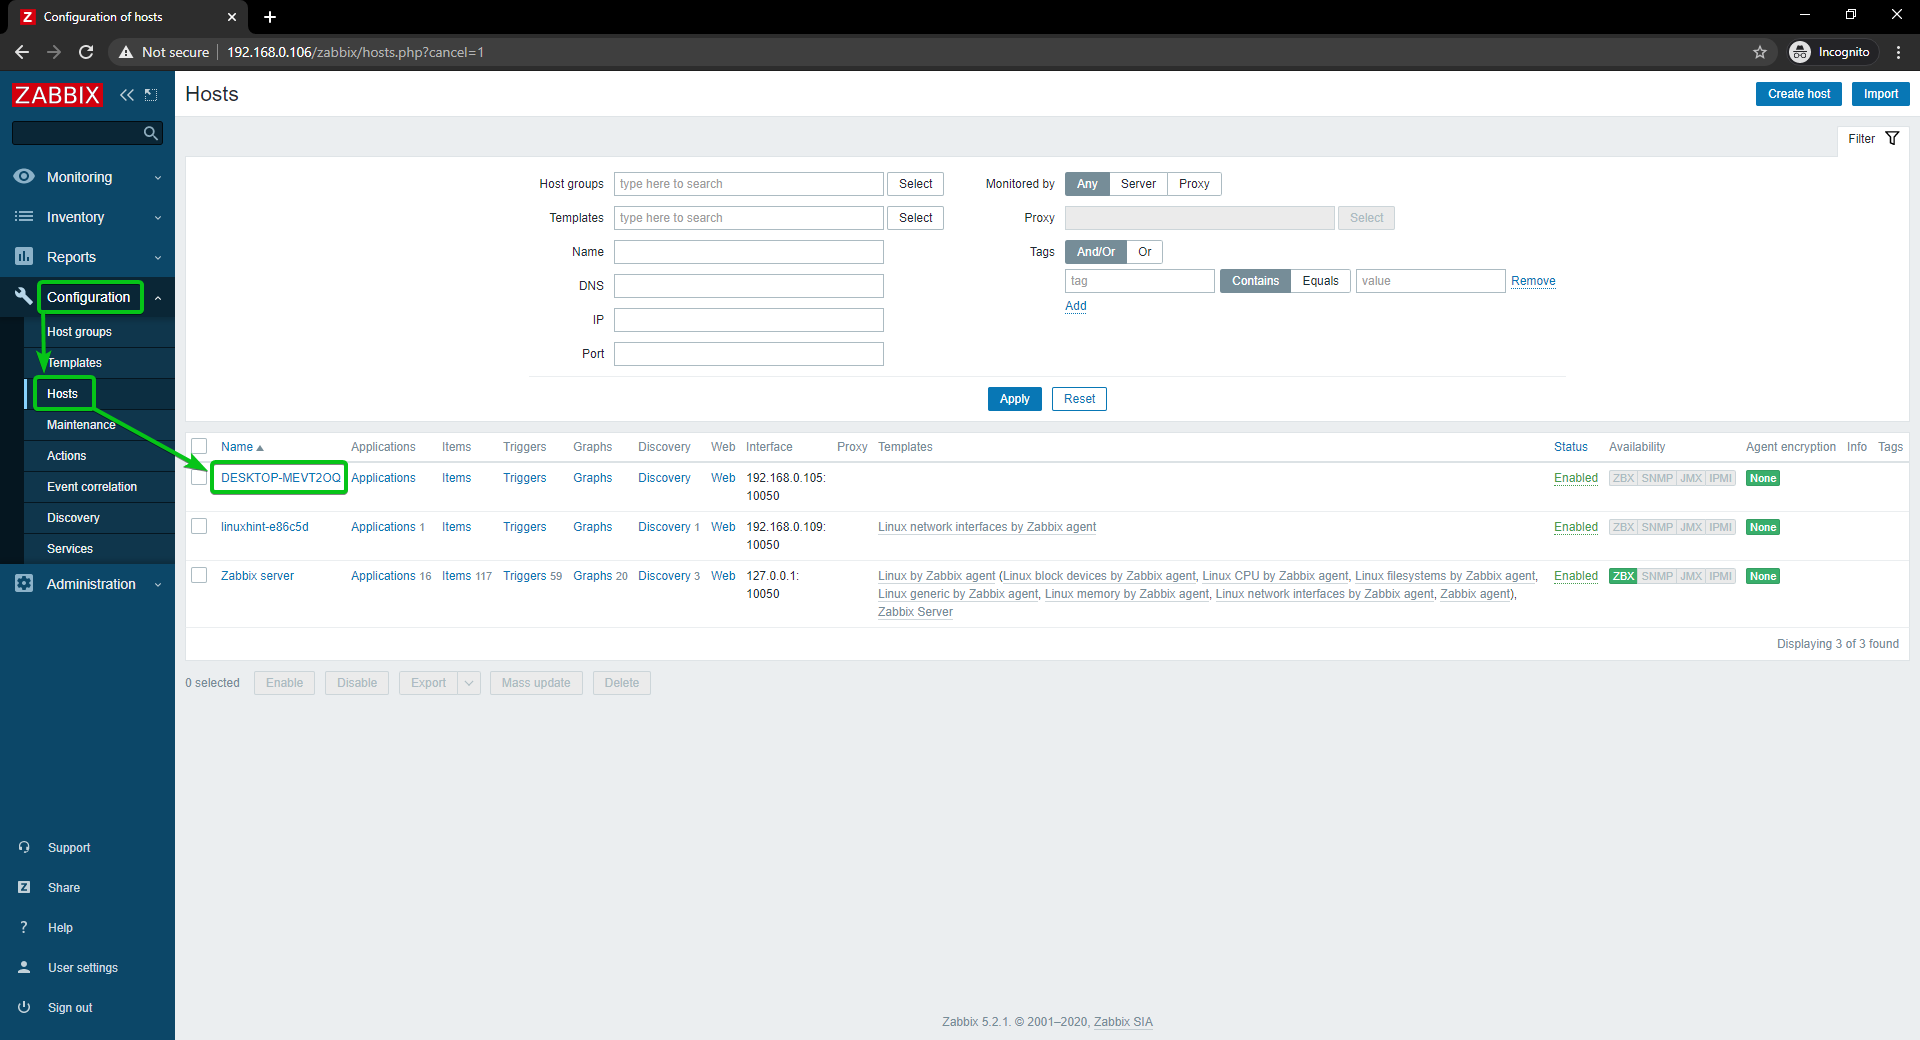
Click on Templates.
Click on Select, as marked in the screenshot below.
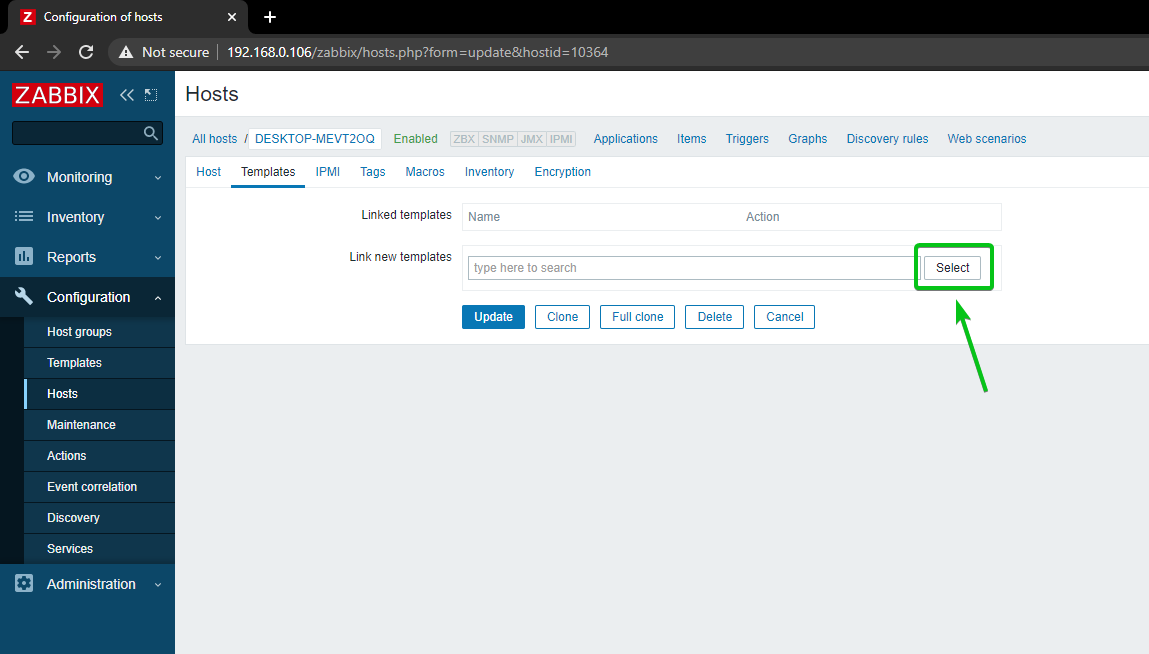
Click on Select, as marked in the screenshot below.

Click on Templates, as marked in the screenshot below.

Check Windows network by Zabbix agent, and click on Select.
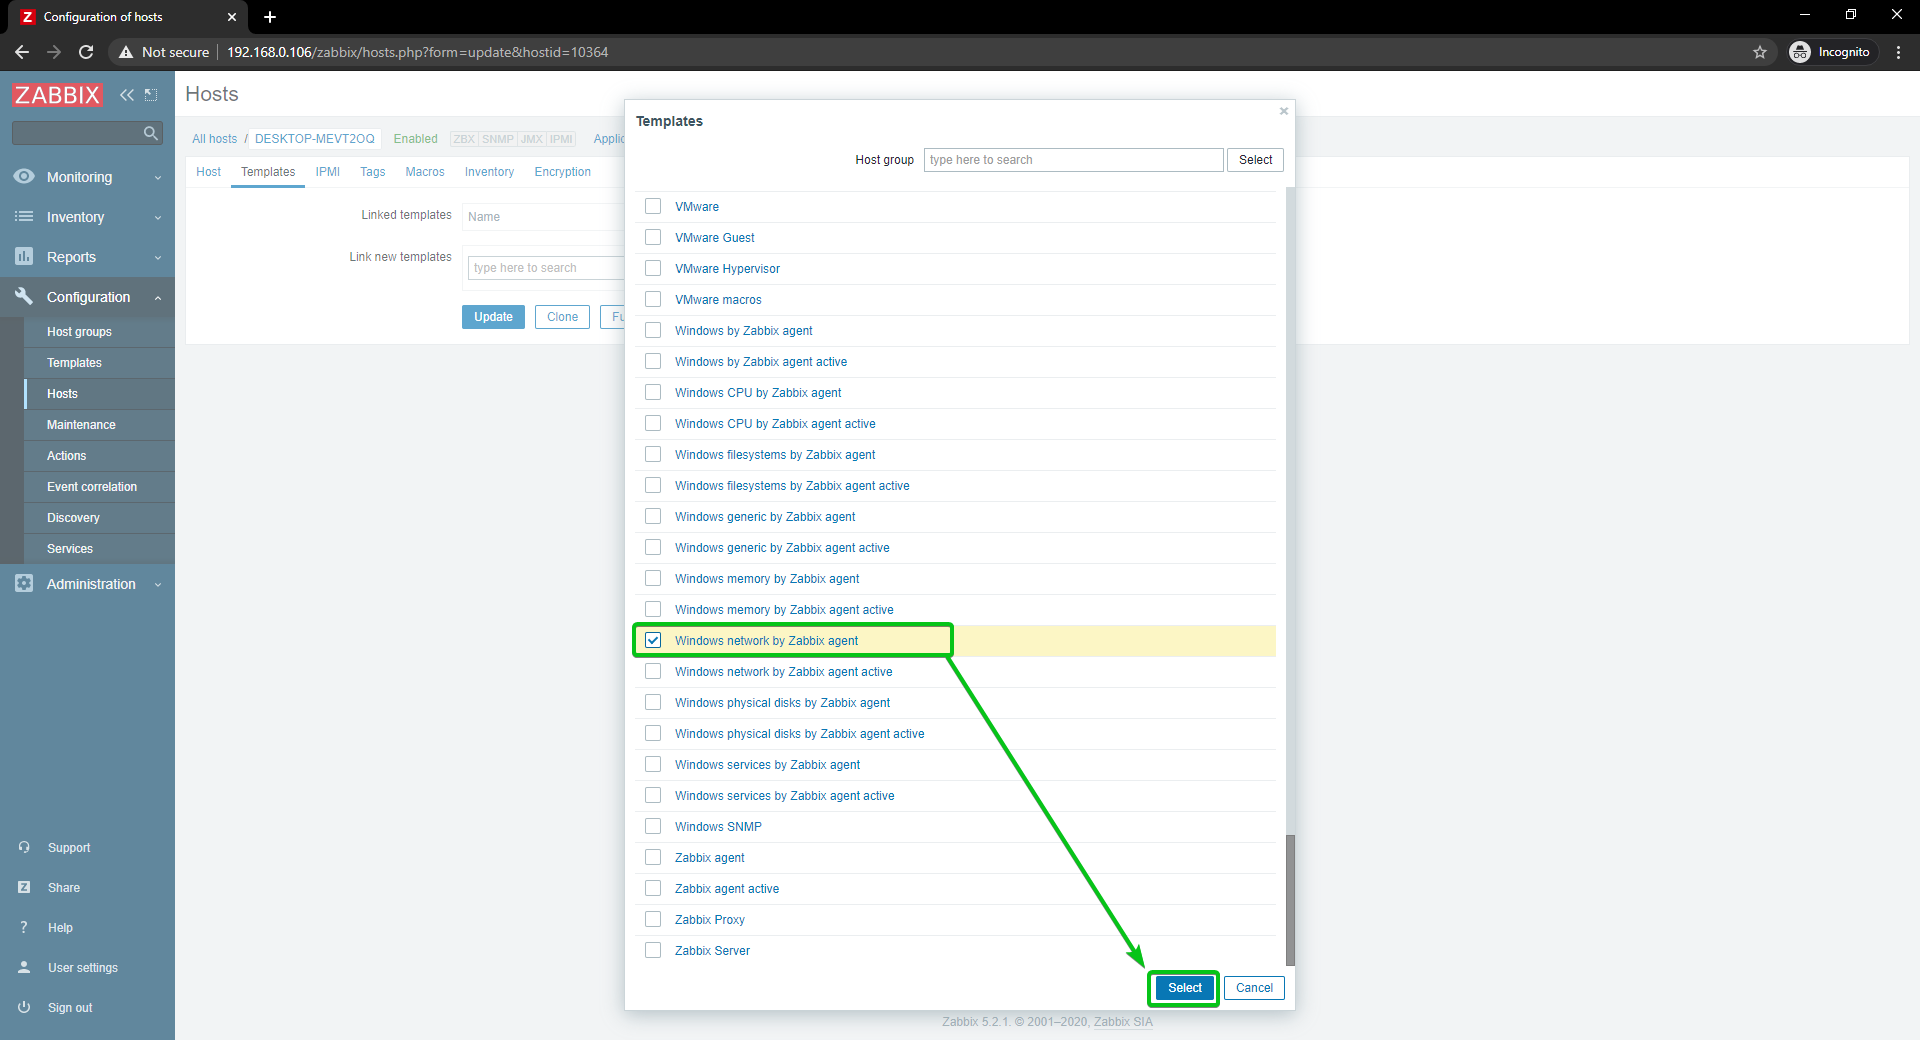
Click on Update.
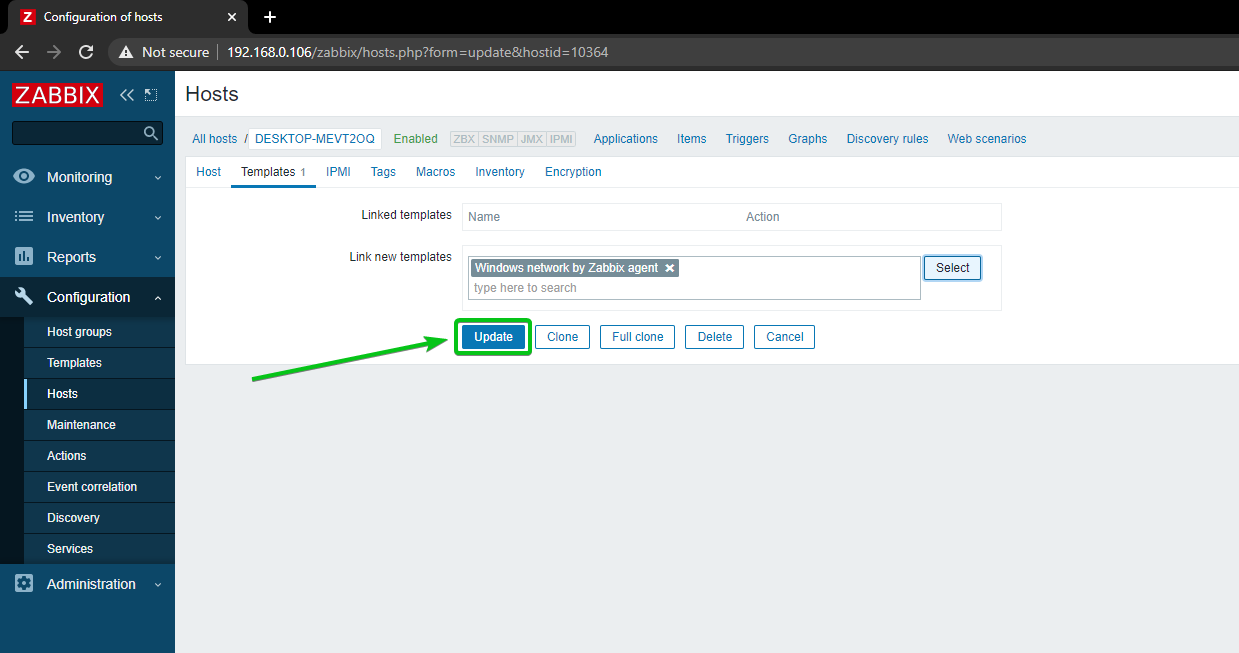
The Windows 10 host should be updated.
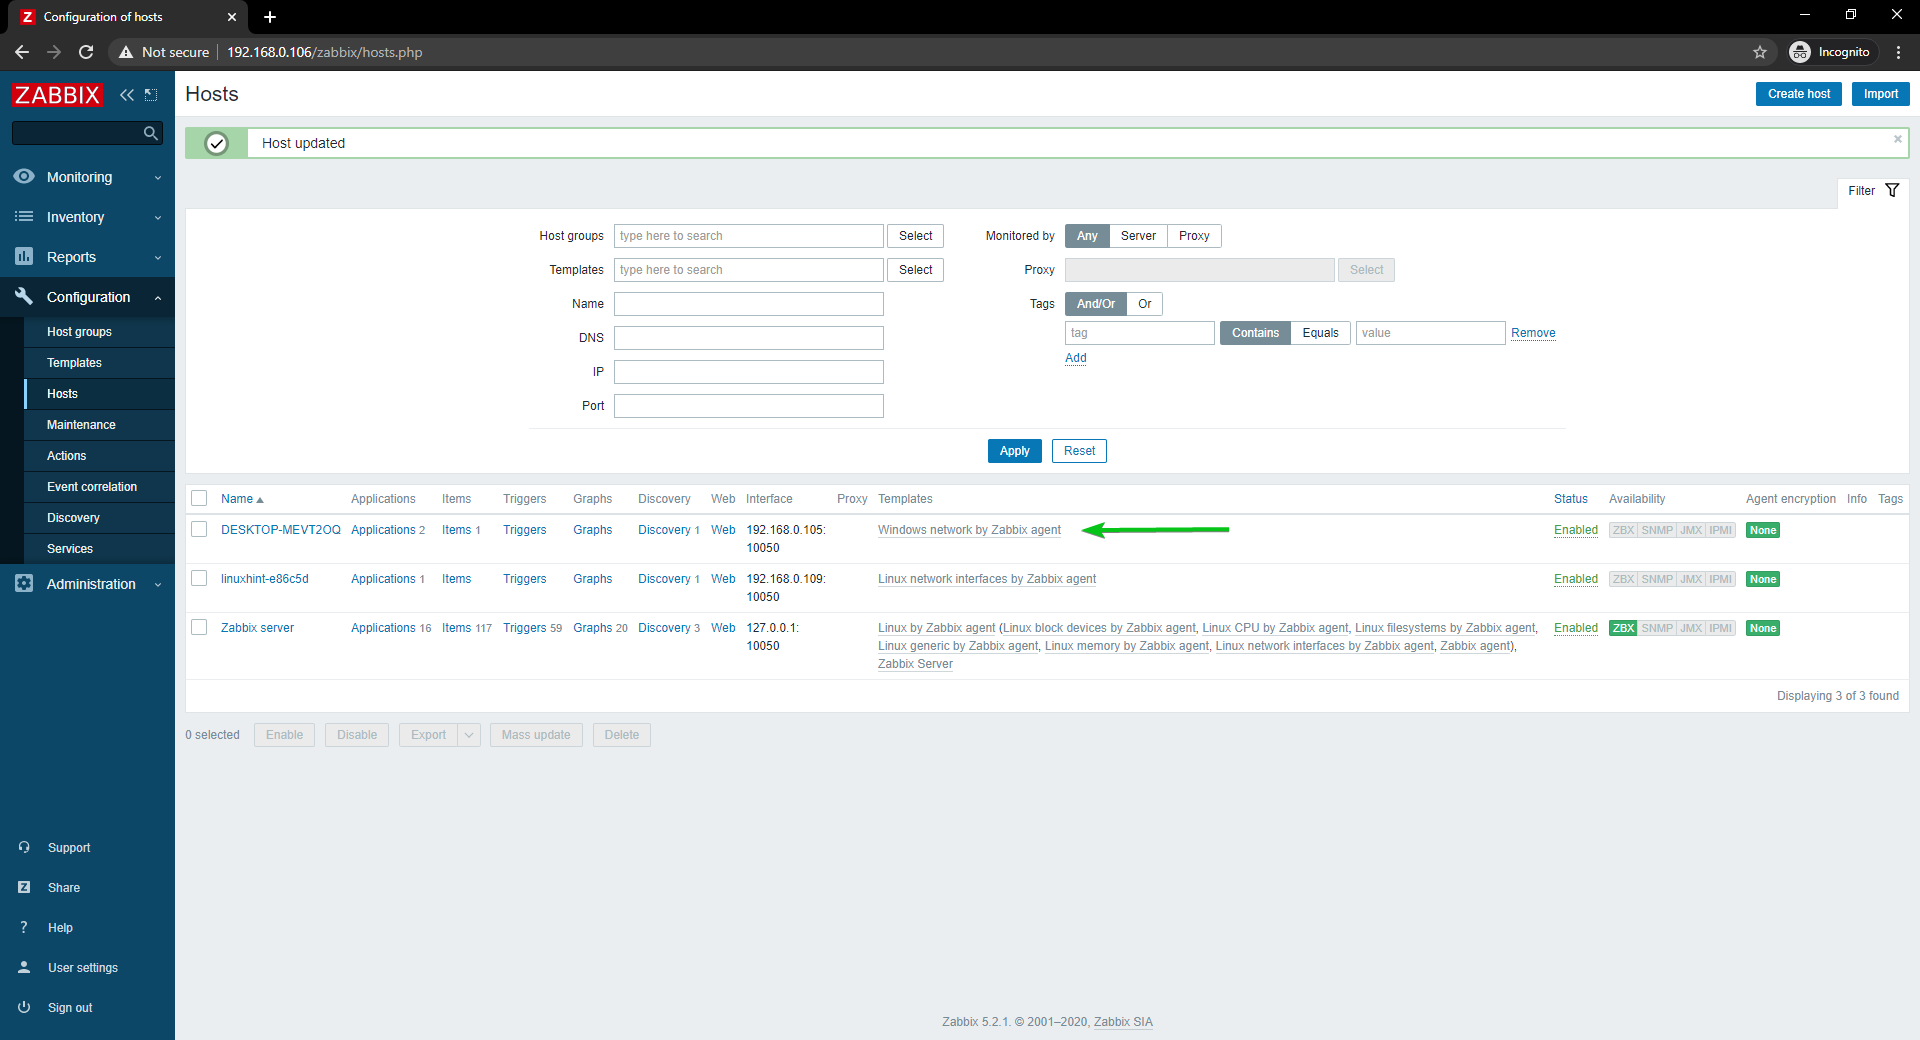
After a while, the ZBX availability option should be highlighted, as you can see in the screenshot below.

When the ZBX option is highlighted, navigate to Monitoring > Hosts and click on the Dashboards link of your Windows 10 host, as you can see in the screenshot below.
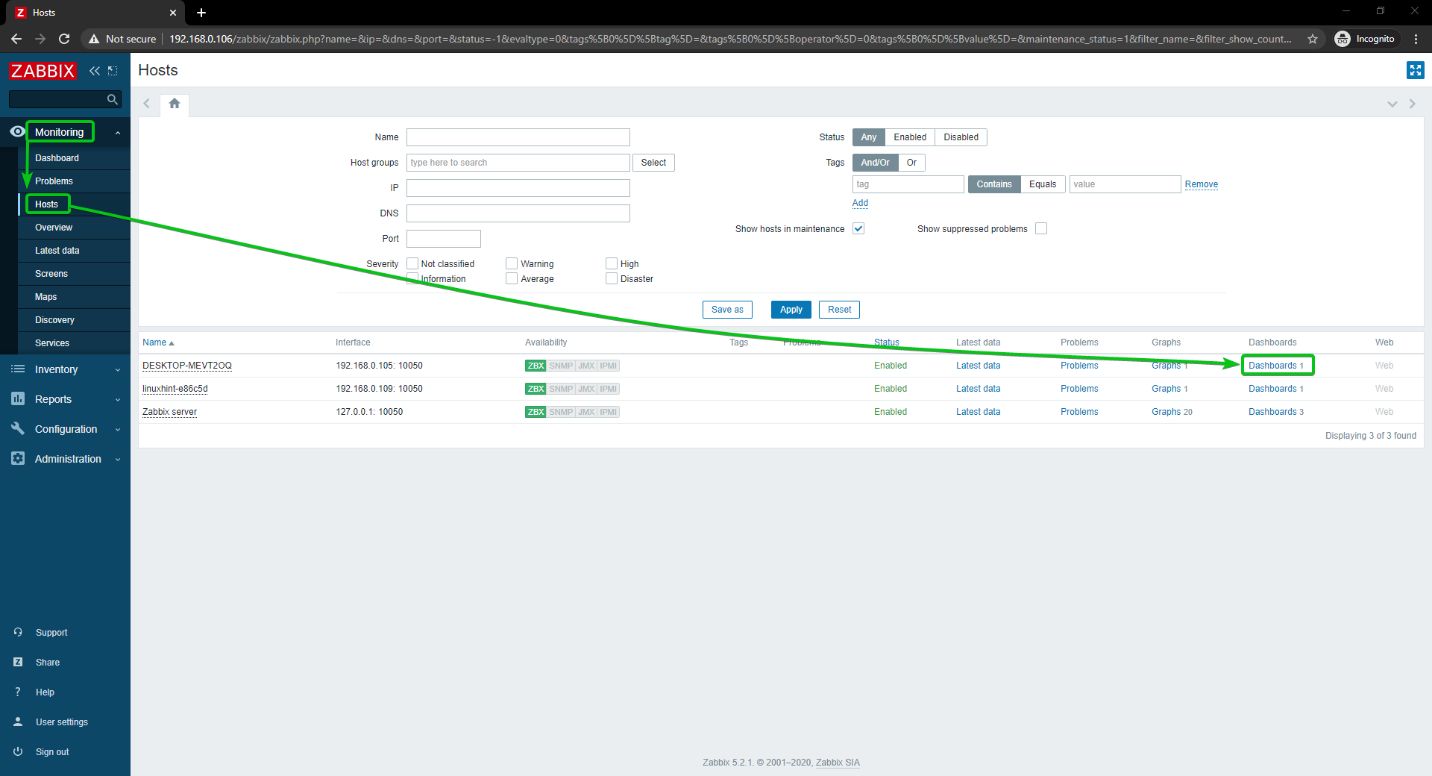
As you can see, the network usage graph is being displayed.
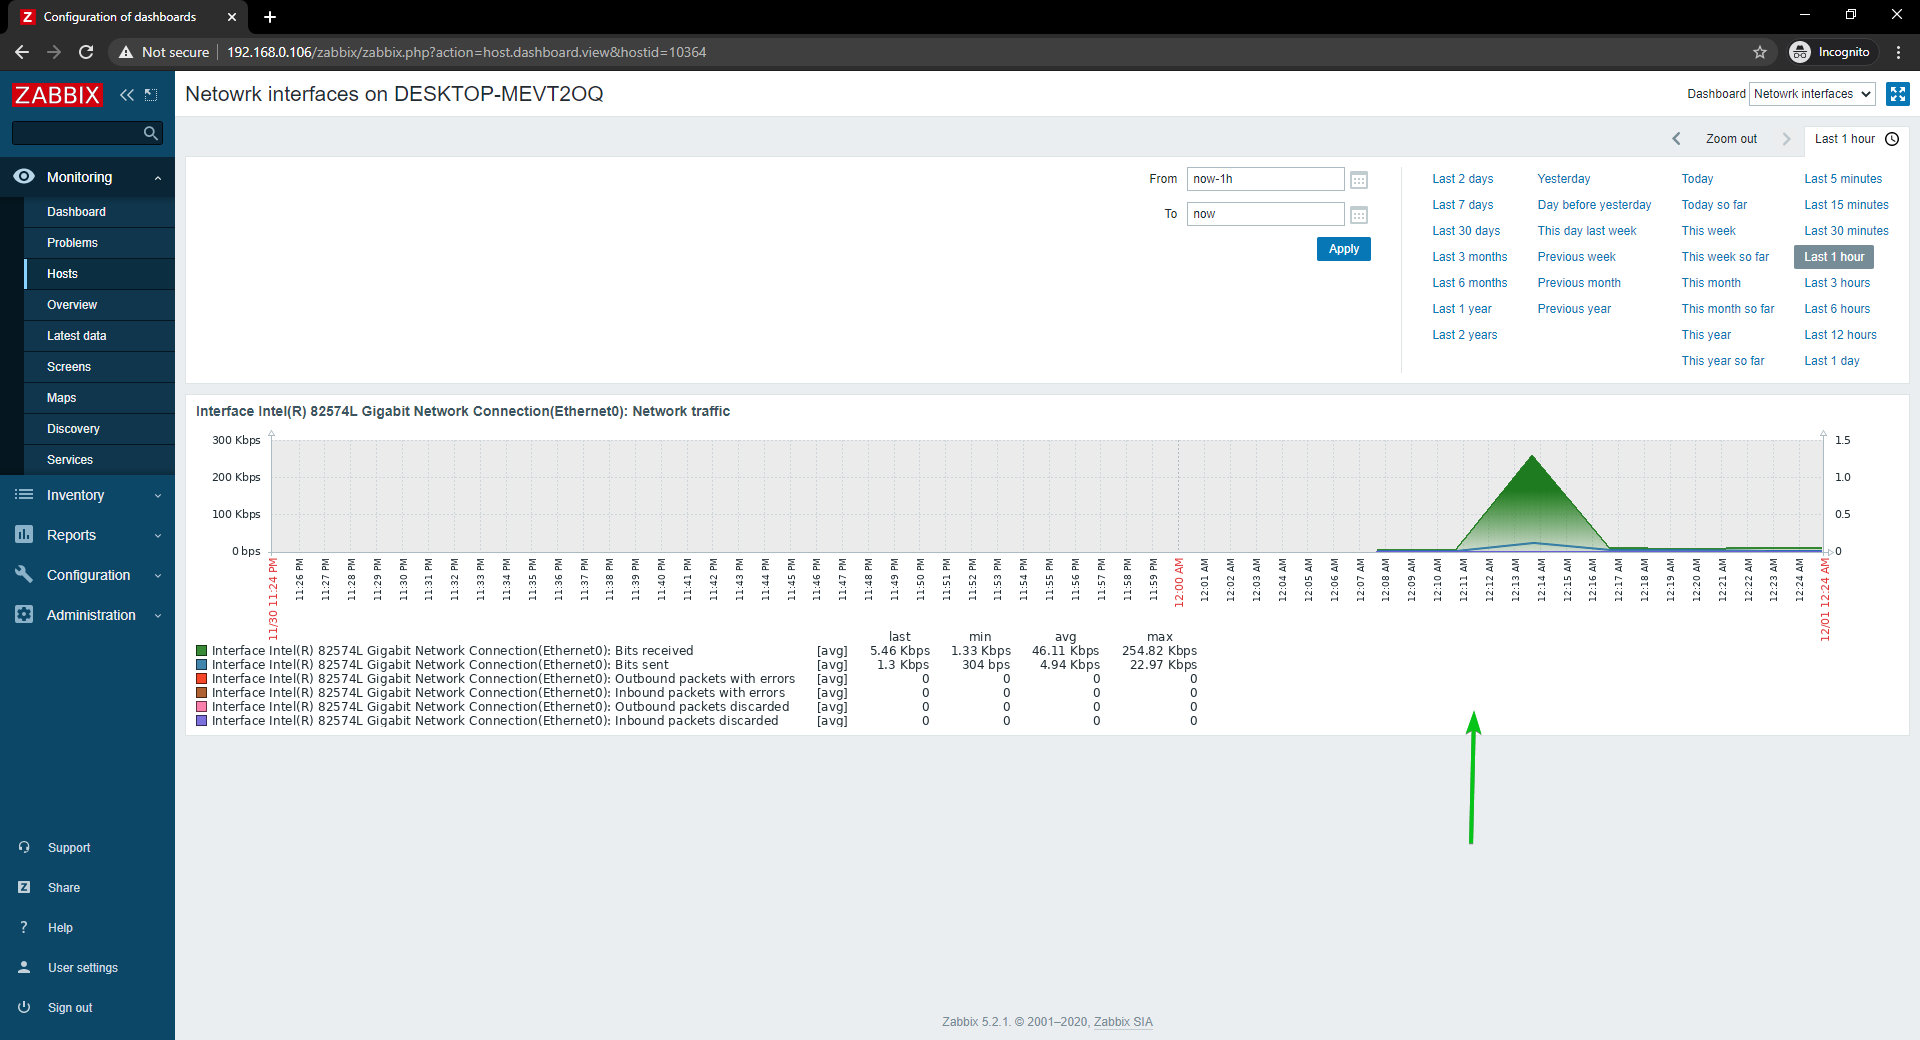
You can change the timeline of the graph as well. As you can see, I have changed the graph time to the Last 15 minutes. The graph is being displayed nicely.
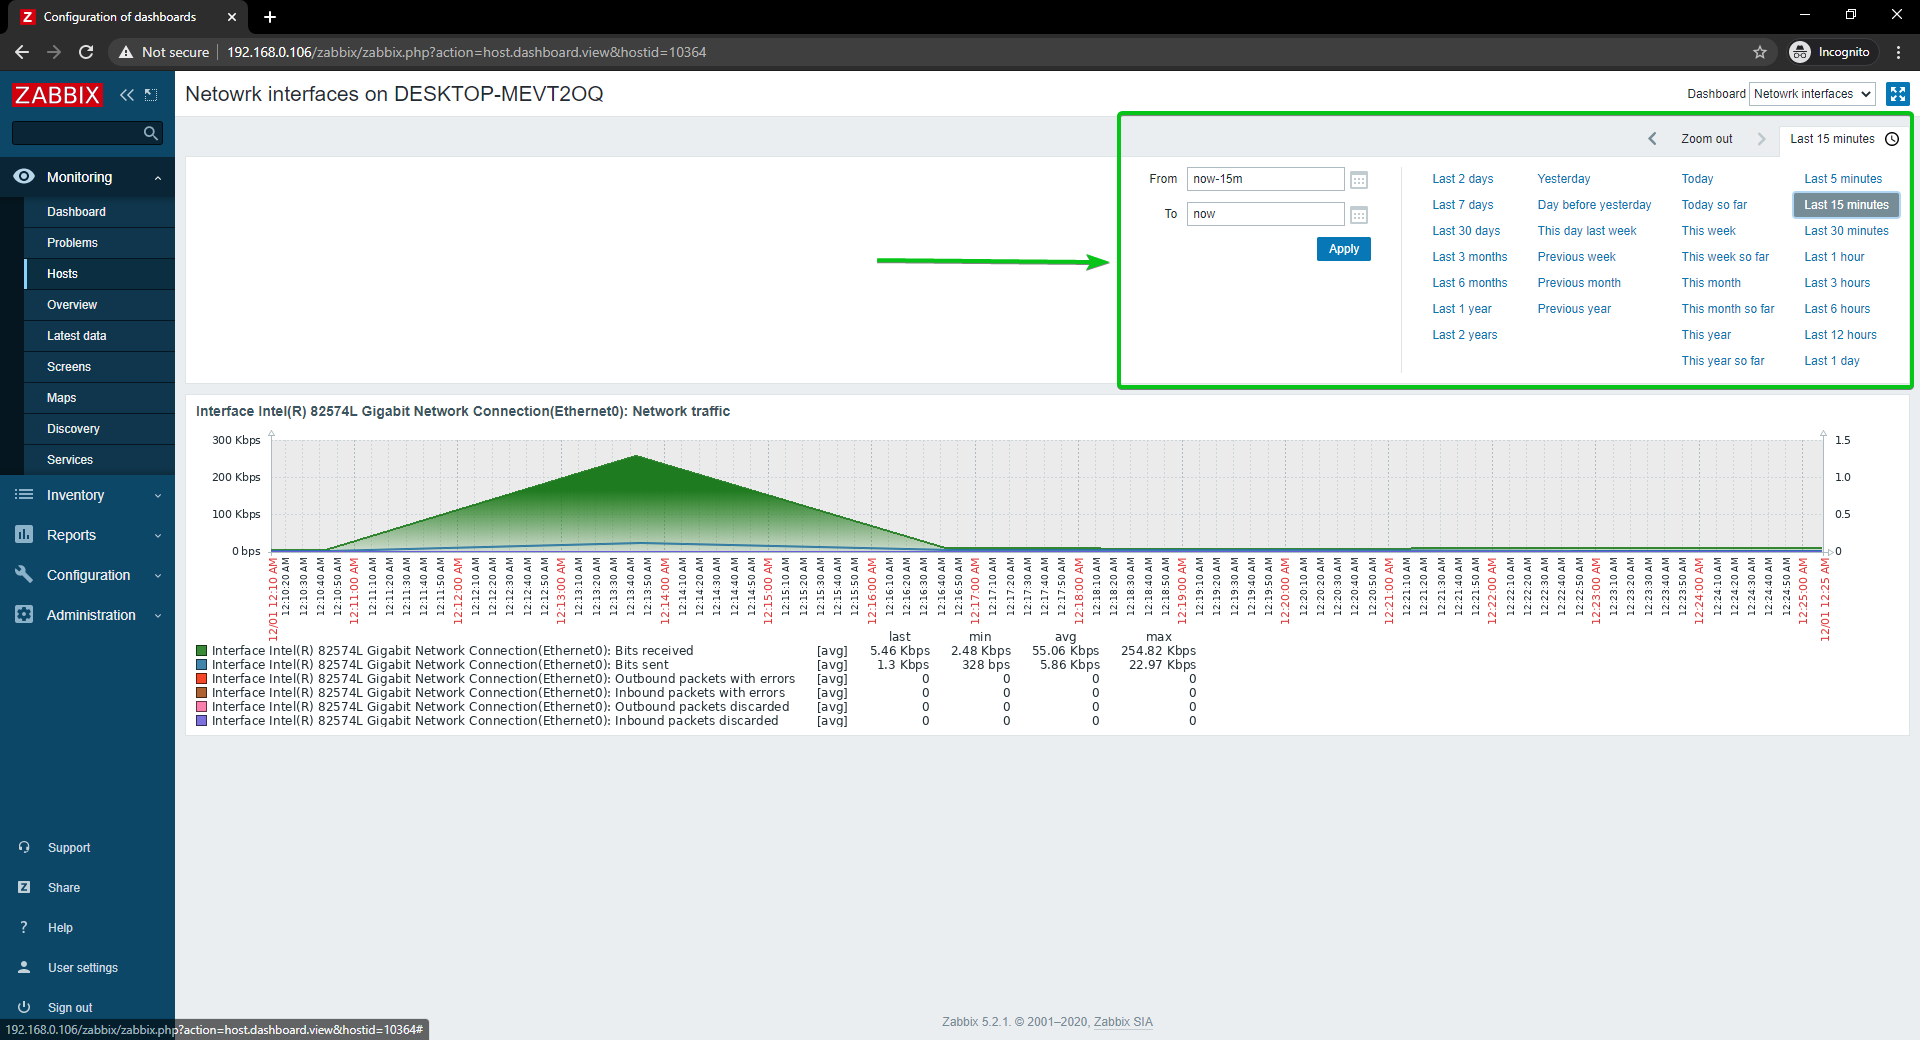
This is how you monitor the network usage of a Windows 10 host using Zabbix on your Raspberry Pi.
Conclusion
In this article, I have shown you how to create a Raspberry Pi network monitor using Zabbix 5. I have shown you how to use Zabbix to monitor the network usage of Linux and Windows hosts on your Raspberry Pi.
from Linux Hint https://ift.tt/3oGR2Ym


0 Comments