


Syntax
# “df.var()”
The above syntax is employed to compute the variance in the dataframe. The “df” in the syntax represents the “dataframe”.
We will be executing the following method for the example explanation of the function of pandas variance:
- Pandas variance calculation for a single column in the dataframe.
- Pandas variance calculation of a single column in the dataframe by changing the argument.
- Pandas variance calculation for multiple columns in the dataframe.
- Pandas variance for the calculation of the entire dataframe columns.
Creating the Dataframe for the Example Implementation of the Pandas Variance
Open the tool “spyder” on your desktop/laptop. Now, first, import the pandas library as “pd” as we are running in the panda’s environment. Let’s create a dataframe; the “df” consists of the names “tom”, “Eddie”, “sam”, “Leo”, and “nick” with their ages as “25”, “44”, “66”, “55” and “78”. We have the missing data of the ages as “20”, “30”, “40”, “50” and the “missing value” also we have their incomes in the dataframe as “78000”, “70000”, “66000”, “33000” and “68000”. And then, we will print the “df” condition that will be used to build the datafarame.
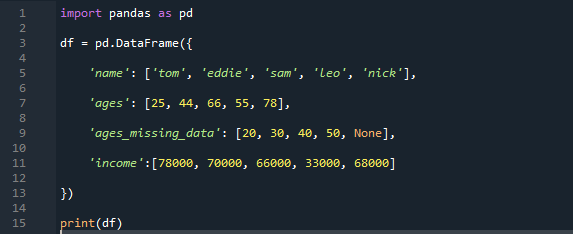
The dataframe is created as we see the display showing the columns and the value we assigned in the code. We can see there is a “NaN” written in the missing data column in the last, which means it is “not a number” and there is no value assigned there.
Example # 01: Pandas Variance Calculation for a Single Column in the Dataframe
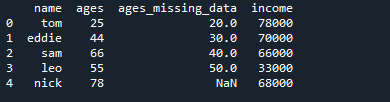
In this instance, we will be determining the variance of a single column from the dataframe. The “df” consists of the four columns “name”, “age”, “missing data”, and the “income”. The names are “will”, “tina”, “lily”, “sea”, and “swany” their ages are “33”, “45”, “35”, “85”, and “78”. The ages missing data have the values as “30”, “40”, “60”,”80” and the missing term as “none” their incomes are as “99000”, “88000”, “77000”, “55000”, and “68000”. Since we will calculate a single column variance, we have to specify a column name with the variance, for example, “income_varience”; here, the “income” column is selected for the calculation of the variance. The function var() with the “df” and the income column specified.
The output displays the calculated variance of the column “income” by using the pandas Var() function.
![]()
Example # 02: Pandas Variance Calculation of Single Column in the Dataframe Using ddof
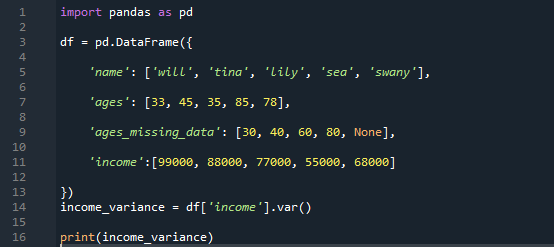
Here we will be using the ddof argument for the calculation of variance in a single column. In the dataframe, the dataframe consists of the names “shein”, “rose”, “Allen”, “Wilson”, and “dom” the ages as “44”, “23”, “55”, “36”, and “41”. The income as “39000”, “8400”, “57000”, “54000”, and “55000” and having the missing ages data column as “20”, “22”, “23”, “25”, and “none”. The question begins with the use of the argument changing to “0”. The answer is that the pandas default is set up as n-1 as the “denominator”, and if we want to use the “n” as the denominator, so we have to use the “ddof” argument and change its value to “0” instead of “1”.
The “of” is the abbreviation of “delta degree of freedom” it works as the divisor used in the calculation as “N”, where it represents the number of elements. Here also, the column can be chosen by choice of yours as by the work needed, we can calculate the variance of any of the columns consisting of numerical values. The column “income” is selected here as well for calculating variance.
The display shows the calculated variance of the column income as “212560000” by using the argument ddof set to “0”:
![]()
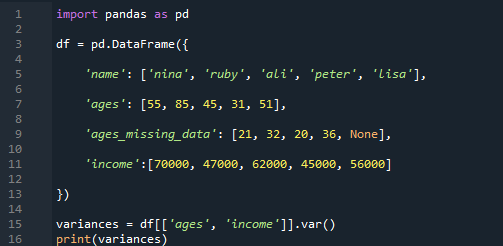
Example # 03: Pandas Variance for the Calculation of the Multiple Columns in the Dataframe
In the first example, we have done the example of how to calculate the variance in pandas of the single column in the dataframe. Now, we will calculate the variance in multiple columns by using the pandas var() function. The dataframe consists of names as “Nina”, “ruby”, “Ali”, “peter”, and “Lisa”, with the ages “55”, “85”, “45”, “31”, and “51”. The missing value data of the ages has the values as “21”, “32”, “20”, “36”, and the missing term. We have the income of those individuals as “70000”, “47000”, “62000”, “45000”, and “56000”.
We have chosen the columns “ages” and the column “income” for the variance calculation in pandas. We can decide the columns and enter them to calculate variance according to further analysis performance.
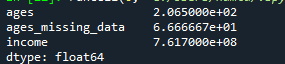
The output consists of the calculated variance of the “ages” and the “income” column as chosen, respectively. We can see that the variance of different columns is shown separately with their column names.

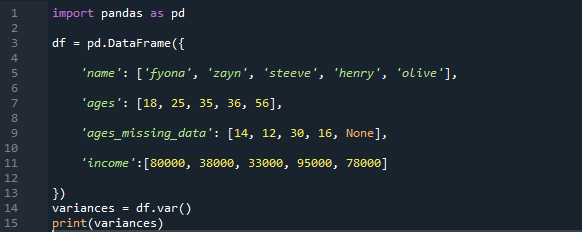
Example # 04: Pandas Variance for the Calculation of the Entire Dataframe Columns
In this example, we will be implementing the pandas var() function for the calculation of variance in the whole dataframe. The data here contains the names “Fiona”, “zayn”, “steeve”, “henry”, and “olive” their ages are “18”, “25”, “35”, “36”, and “56”. The age missing column has the values “14”, “12”, “30”, “16”, and “none”. Their income is “80000”, “38000”, “33000”, “95000”, and “78000”.
The basic syntax is used for every column of the dataframe variance calculation; the dataframe selected the whole column with the “var()” function. The print variance statement will print all of the variances calculated.
The output displays the variance calculations of the columns of the dataframe, which were in numerical values. Such as “ages”, “missing ages”, and the “income” column. The name column has the characters, so their variance cannot be calculated.
Conclusion
The pandas variance is a very helpful yet very technical function. It helps to calculate the variance very easily by using the function var() of pandas. In this article, we have learned all the methods with example execution of each one for a better understanding. We have done the single-column calculation of variance in pandas, multiple-column variance calculations in pandas, the one with changing the argument from the default setting, and also the variance calculation application on the complete dataframe. Each of them is very useful on its own, depending on the usage and the condition by the need of time.
from https://ift.tt/6F1DpLm


0 Comments