


This post will provide a practical guide to debug an error in JavaScript and it will be organized as follows:
- A simple JavaScript program to concatenate two values
- Error in JavaScript Program
- How to Debug Error in JavaScript?
- A Practical Guide to Debug an error in JavaScript
So let’s get started!
A simple JavaScript program to concatenate two values
To understand the concept of JavaScript debugging, we will consider a very basic example.
<head>
<script type="text/javascript">
function concat(){
var value1 = document.getElementById("val1").value;
var value2 = document.getElementById("val2").value;
document.getElementById("con").innerHTML="Concatenated Value = "+(value1 + value2);
}
<input id = "val1" type="text" placeholder="enter a value"/>
<br><br><br>
<input id = "val2" type="text" placeholder="enter a value"/>
<br><br><br>
<button onclick="concat()" id="btnConcat">Concat</button>
<h2 id="con"> Concatenated Value = </h2>
</body>
</html>
We created a very simple program that will concatenate the two values on clicking the button. Following window will appear on successful execution of the code:
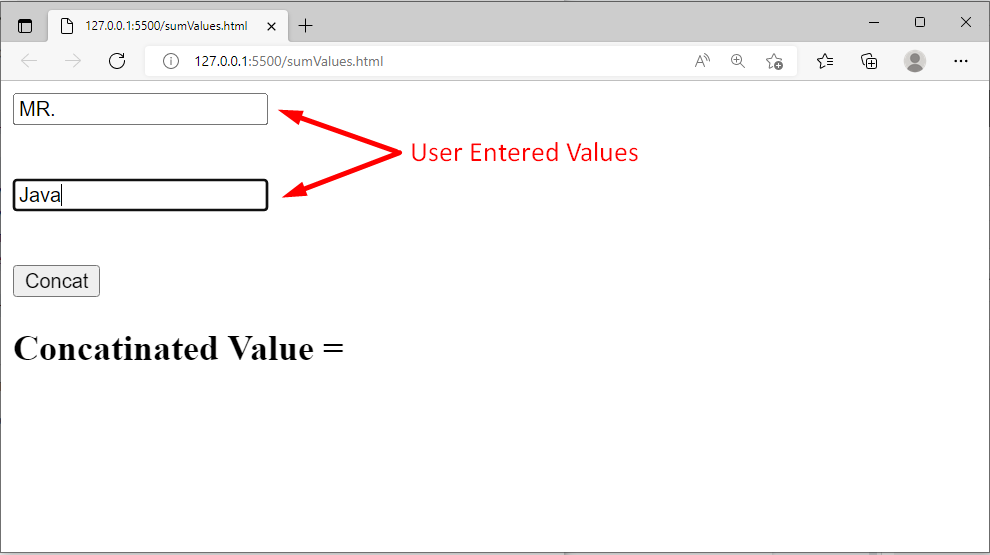
The user entered two values i.e. “MR. ” in the first text field and “Java” in the second text field. Clicking on the “Concat” button will produce the following output:
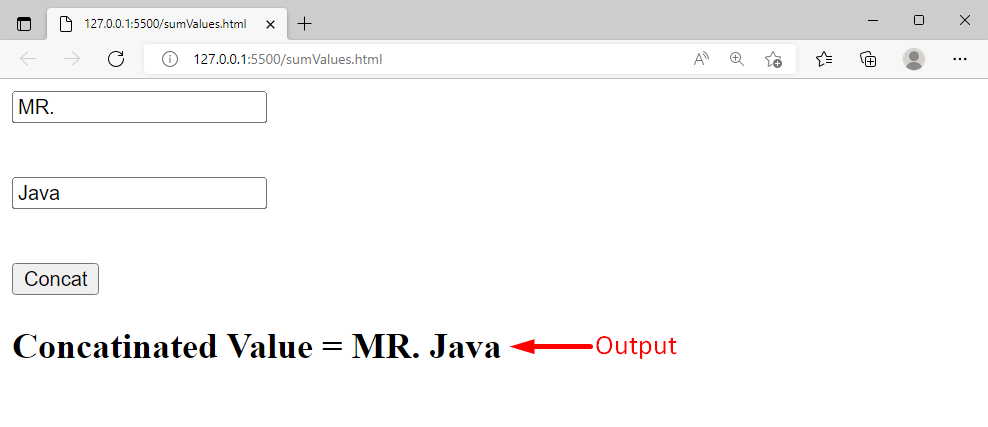
The output verified that our program is running perfectly fine.
Error in JavaScript Program
Let’s say we forget to utilize the concatenation operator “+” in our code:
Such type of error can’t be detected by the text editors:

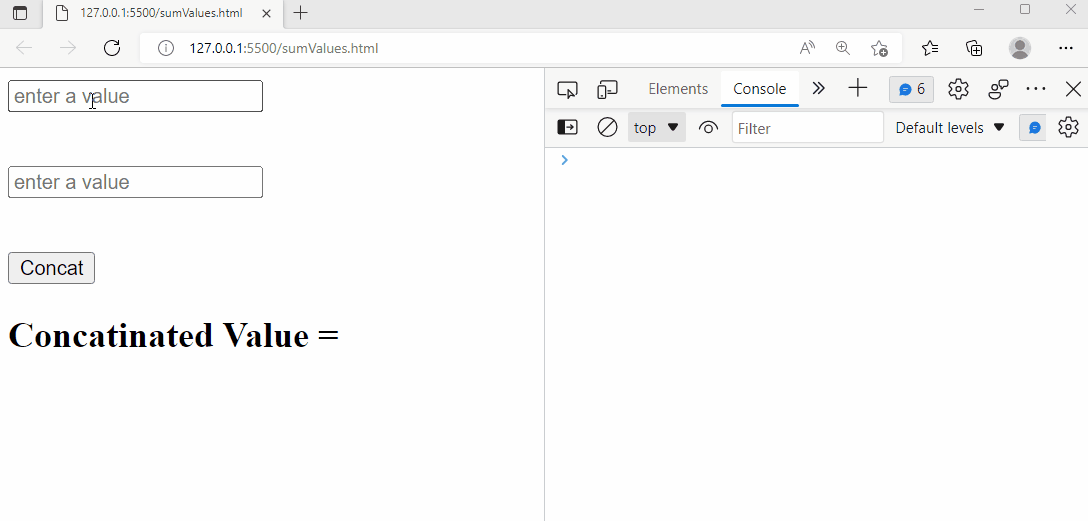
Now this time when we run the code, we will get the following output:
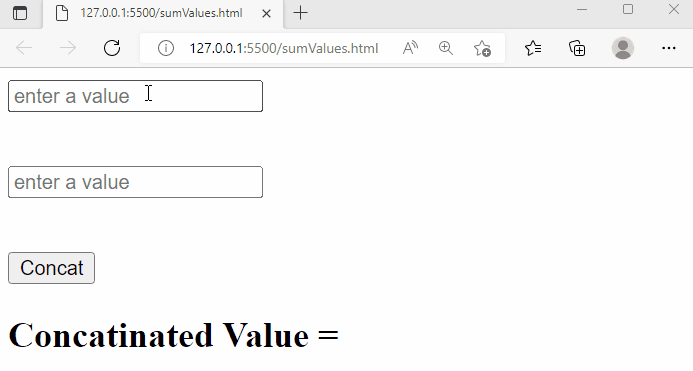
Clicking on the button doesn’t perform any action, it shows that something went wrong with our code.
How to Debug Error in JavaScript
In the above example, we observed that there is an error in the program. But what exactly is the error and how to debug it in JavaScript? Well! All the modern browsers come with developer tools and a console where we can perform the debugging. In most modern browsers, “F12” is the short key to open the developer tools. Pressing the “F12” key will open the following window:
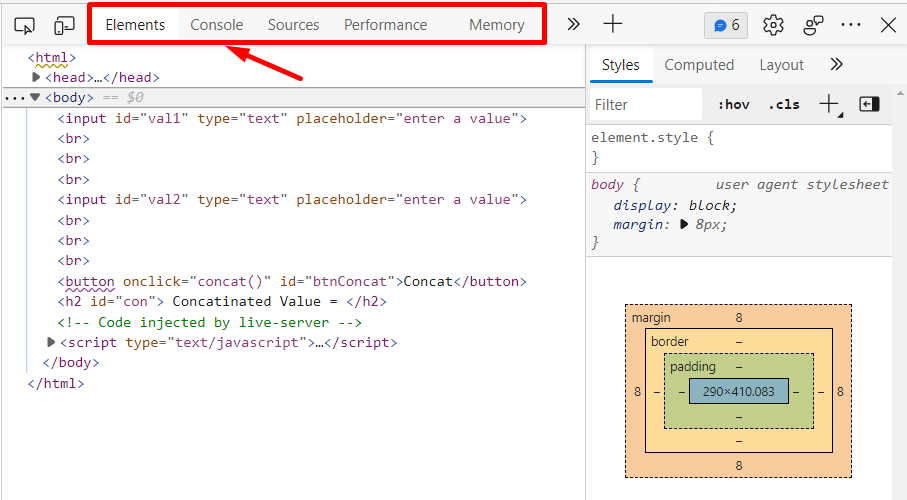
At the top, you will find the different tabs, for example, the first tab is the “Elements” tab, and clicking on the Elements tab will show us the complete code/tags. The second tab is the “Console” tab where we can perform the debugging, and so on.
JavaScript provides a method named console() that can take some values/expressions and print the result on the browser console. In JavaScript, the console.log() method is usually used for debugging purposes.
A Practical Guide to Debug an error in JavaScript
As of now we have learned what is an error and how to debug it in JavaScript? In this section, we will provide a practical guide to demonstrate how to debug an error in JavaScript:
In this example program, we will utilize the browser’s developer tools to debug the error:
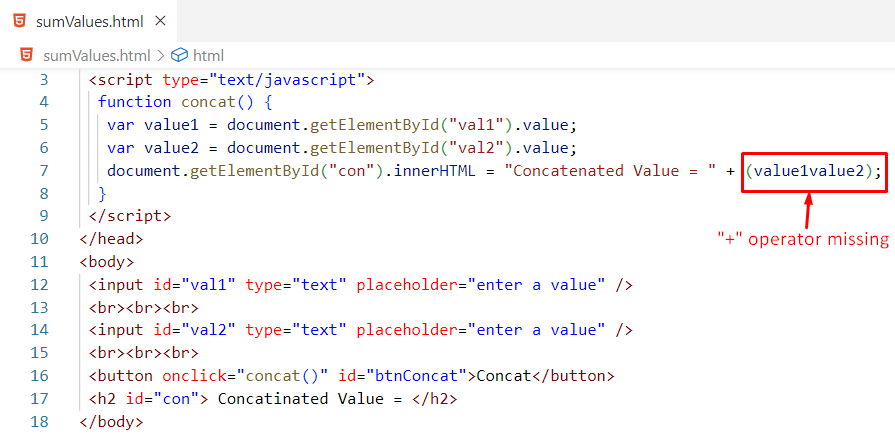
In the above snippet, we missed the “+” operator between value1 and value2, consequently, our program wouldn’t work appropriately:
The output verifies that the error is debugged in the console window and it provides complete details about the error i.e. what kind of error it is? Which line causes the error etc.
In this example program, we will utilize the console.log() method to debug the error:
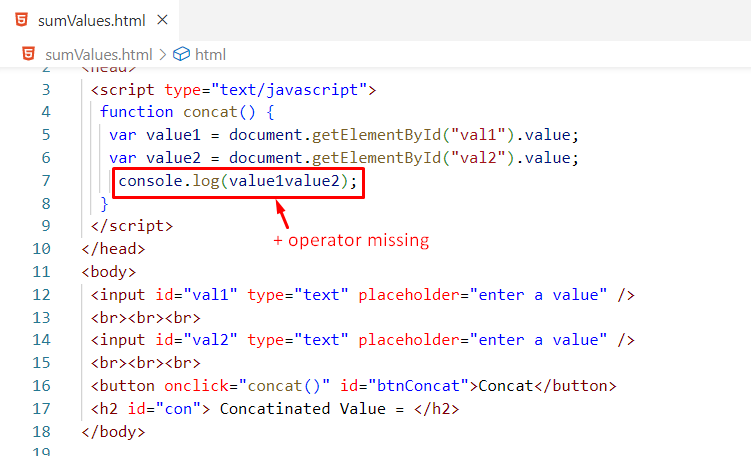
In the above program, value1value2 is not defined anywhere in the program. But still, the text editor didn’t show any kind of error, however, it will be debugged in the browser’s console:
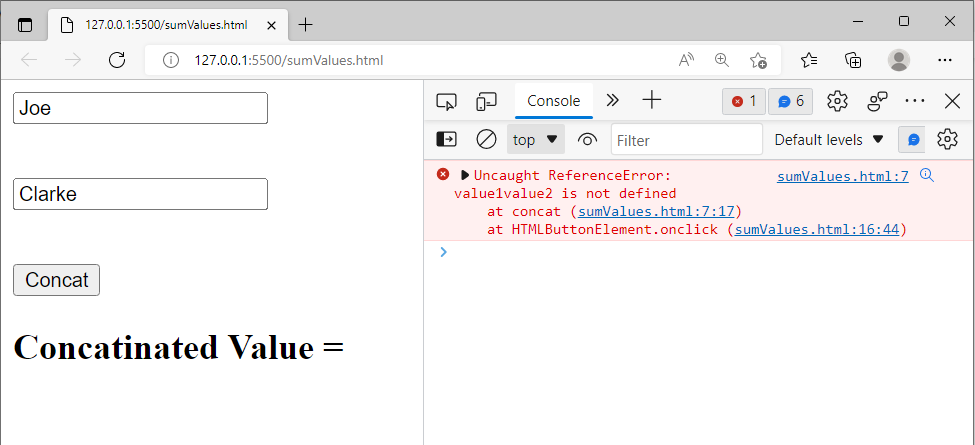
The above snippet explained that value1value2 is not defined in our code, the error occurred because of line 7, and the error occurred when we clicked on the button.
Conclusion
In JavaScript, a text editor can’t debug some errors. However, in JavaScript, the browser’s developer tools and console.log() method can be used to debug the errors. In most modern browsers, “F12” is the short key to open the developer tools. This write-up presented a complete practical guide to debug errors in JavaScript.
from https://ift.tt/JXK4MBz


0 Comments