


The following ways can be adopted to check RAM usage on Manjaro.
– Using terminal
– Using Graphical Interface
How to check RAM usage in Manjaro Linux using terminal
This section lists down the commands that can be used to get the information about the memory being used by the Manjaro.
free command : This command in Manjaro’s terminal can be used to check the detailed information about the Memory of your Manjaro. The output of this command will display the detailed information from where you can get the used memory information as well.

The output contains detailed information about RAM like the Total, Used, Free space of RAM. The measuring unit used by the free command is MB. Currently, 659MB of RAM is being utilized by several processes of Manjaro.
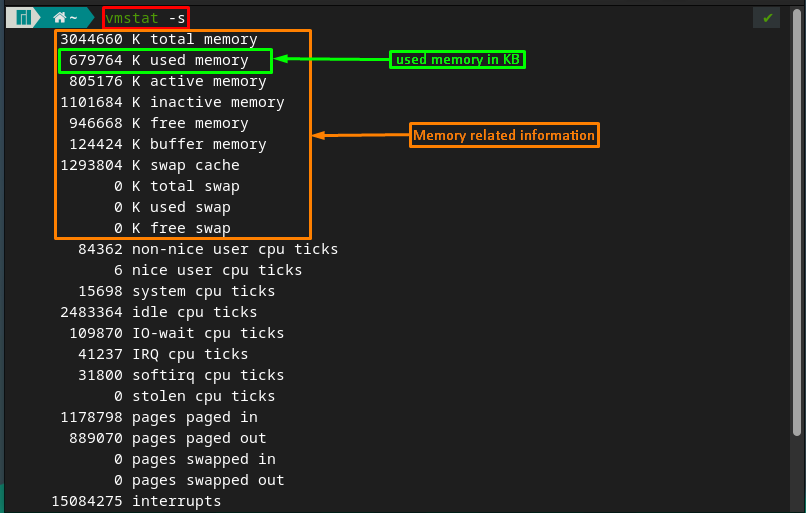
vmstat command : The vmstat(virtual memory stats) command is a widely used Linux-based utility to get the information about memory, CPU scheduling and many more.To get the detailed information, you have to issue the following command.
The first few lines of output list down the information about the memory and from here you can get the amount of RAM used.
Note : The -s flag enables the vmstat command to get the information in a detailed and sequential manner.
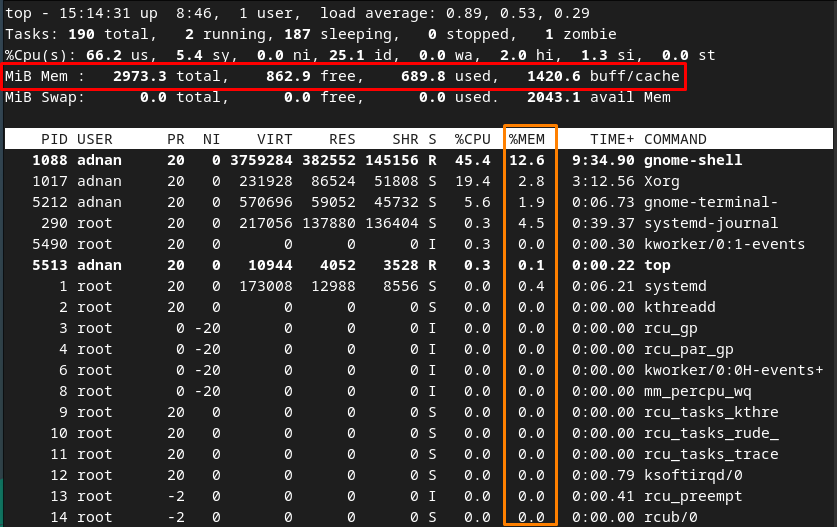
top command : The top command also allows you to have a look at memory usage. Although this command serves several other purposes as well, we are using it here to get the memory-related data only. So, you can use the below-mentioned top command to get the statistics of memory usage (alongside other stuff as well).
It shows the total usage of memory in the above pane of the windows, whereas the tabular interface refers to the memory consumed by each process of the system.
How to use “ps_mem” Python script to check RAM usage on Manjaro
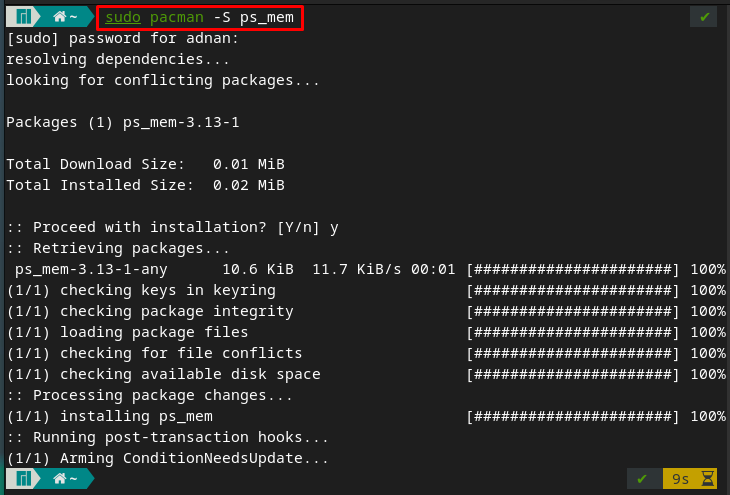
The ps_mem is a simple python script that actually calculates the private and shared RAM and then sums them up to calculate the RAM being used by each process. This kind of information is considered a precise one when compared to other methods. To use this, you have to first install it on your Manjaro system by issuing the following command.
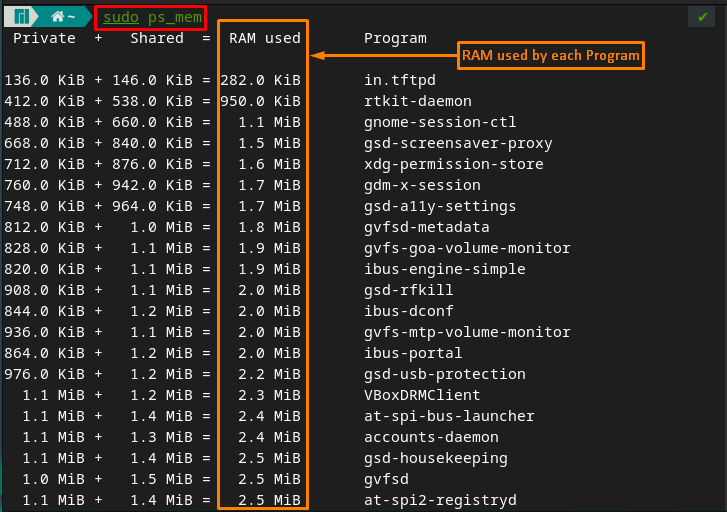
You can run the ps_mem script as follows,
How to use htop to check RAM usage on Manjaro
The htop is a command-line tool that provides extensive detail about the functionality of various components, like CPU utilization, memory usage, etc. Interestingly, you can check the memory usage by each process and as a whole system as well. But wait, you have to install this handy tool on Manjaro with the help of the command written below.
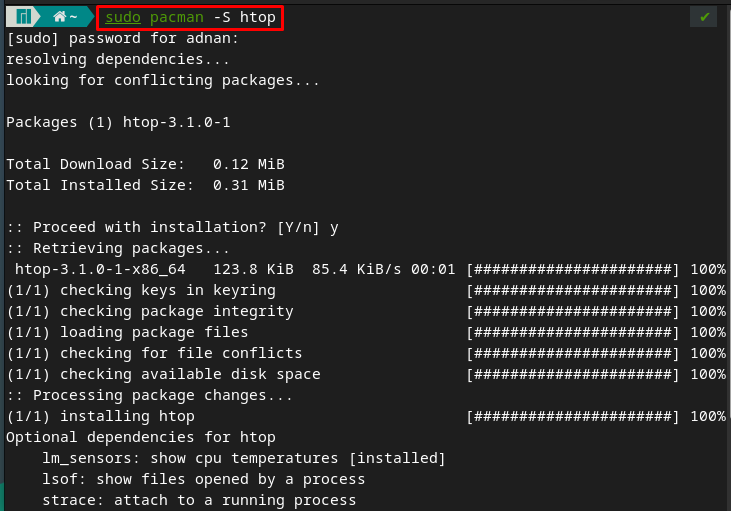
After successful installation, it can be run from the terminal with the help of the following command.
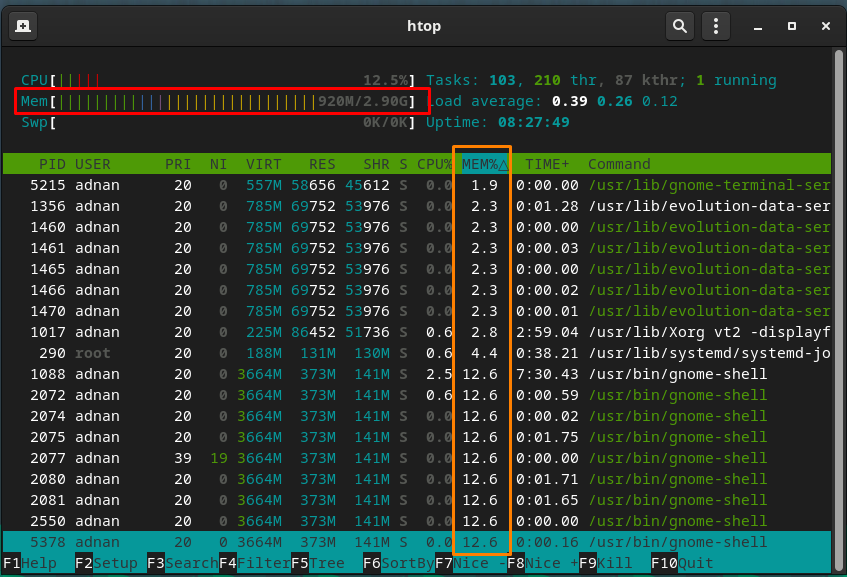
The output shows a detailed statistic about several components of the system. In the image provided above, total memory usage is shown(in a red-colored rectangle) on the upper pane of the window. Whereas the memory being used by each process is shown in an orange-colored rectangle.
How to check RAM usage in Manjaro using Graphical Interface
The graphical interface of Manjaro contains quite rich programs by default. You can also check the RAM usage of the Manjaro system using Graphical Interface. To do so, you are required to carefully follow the steps mentioned below.
Step 1 : Open the dock and click on the “System Tools“.
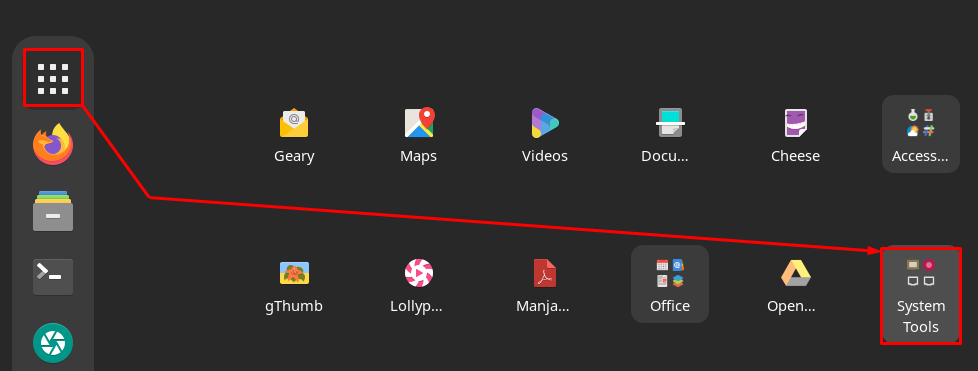
Step 2 : From “System Tools“, navigate to an application named “System Monitor“.

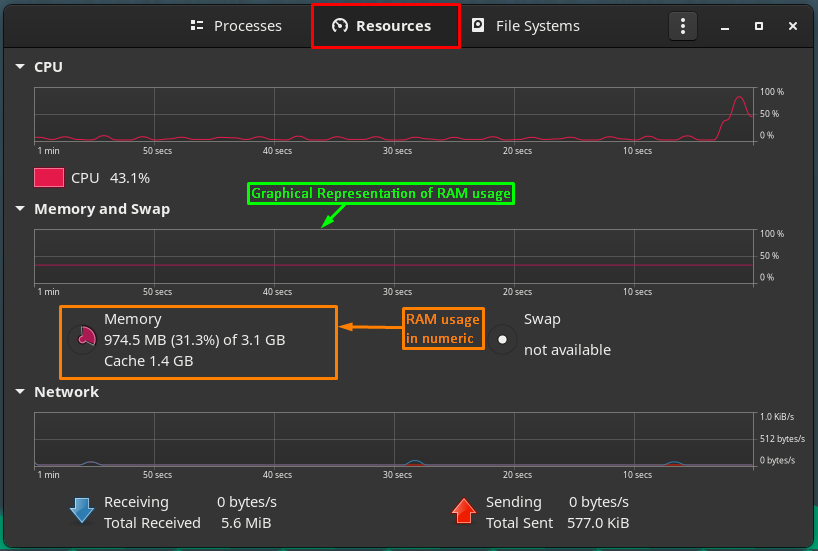
The “System Monitor” application contains information about different components of the system.
For instance, their “Processes” tab shows the memory details according to each process.

For a graphical representation, navigate to the “Resources” tab. Here, you will observe the graphical representation of memory being used and also a numeric statistic as well.
Conclusion
RAM is a core component of a computing device and plays a key role in the performance of a machine. To get better performance, it is recommended to keep an eye on the RAM being used by the system’s processes. So, here we have presented several ways to check the RAM usage in Manjaro Linux. This guide can be followed by the users to look for the memory usage by the whole system and an individual program as well. In these ways, a user can look for the alternatives of the programs that are consuming more memory. Resultantly, the user can experience better performance.
from https://ift.tt/3GkhkYW


0 Comments