These issues might seem insignificant but they end up causing issues for servers with production applications that is why alerts are created to inform the stakeholder whenever the above mentioned events happen. In this article we’ll guide you how to create monitors using the DataDog tool and will create alerts to check on RAM usage and CPU usage.
DataDog Installation on Ubuntu
Firstly, we’ve to create an account on DataDog and for that visit the page and register yourself. After you’ve registered they’ll provide you with an API key which you’ve to use for the installation of DataDog on Ubuntu, here below replace the DD_API_KEY with the key provided to you:
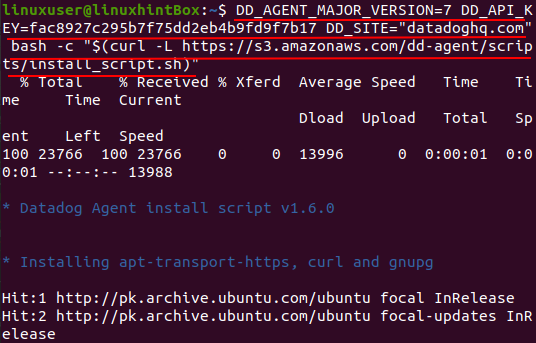
The installation might take some time, at the end you’ll receive the following message:
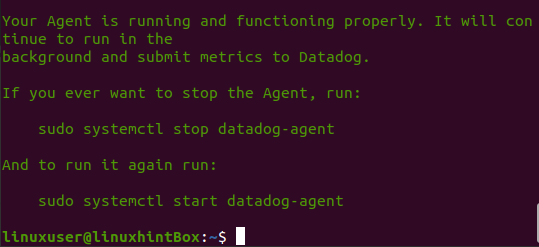
DataDog agent is running successfully in the background as shown above and will continue to run. In case you want to stop the DataDog agent run the provided command:
To start the agent:
After you’ve created the id and installed the given command, you’ve set the agent for DataDog and you’ll be on the homepage:

Now let’s start working in Datadog to create monitors.
Creating a New Monitor
In case you want to add a new monitor you can simply select Monitor from dashboard and click on “New Monitors”:

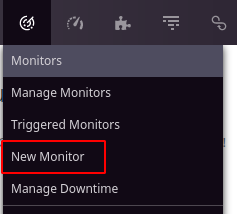
Otherwise, to create a new monitor in order to check if the host is up, you can select the option “Create a Monitor” in the side menu and click “Create Monitor”:

This will open up the following screen in which you’ve to select on the “Host”:
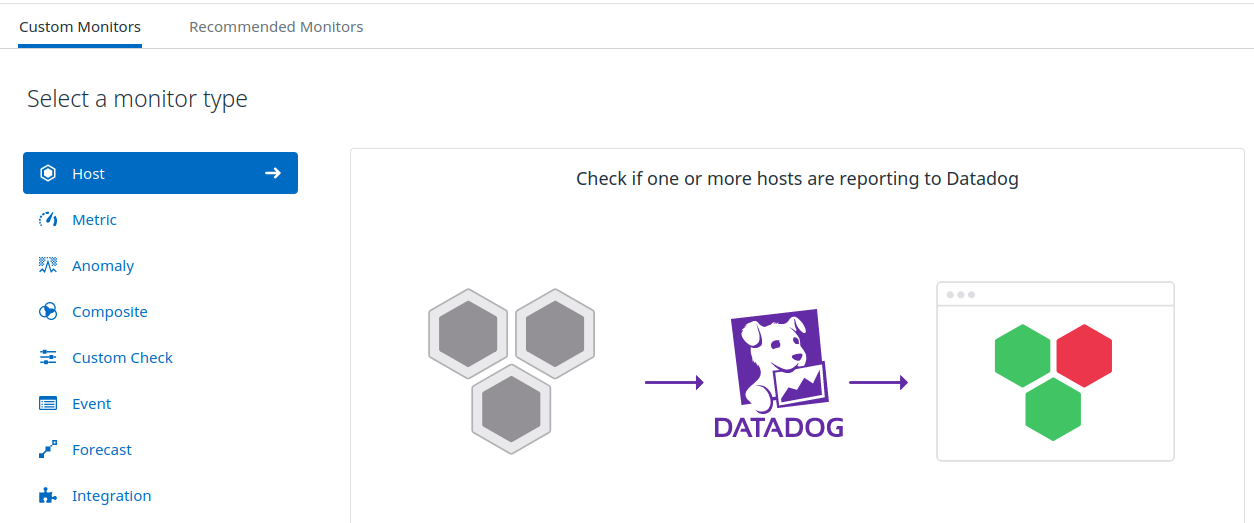
After clicking on host it will take you to another screen where you’ve to pick a host.
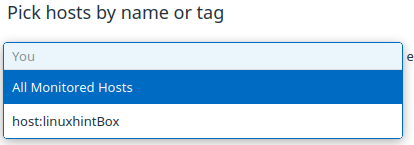
Select the host which in my case is “linuxhintBox” and you’ll get the following options to fill:
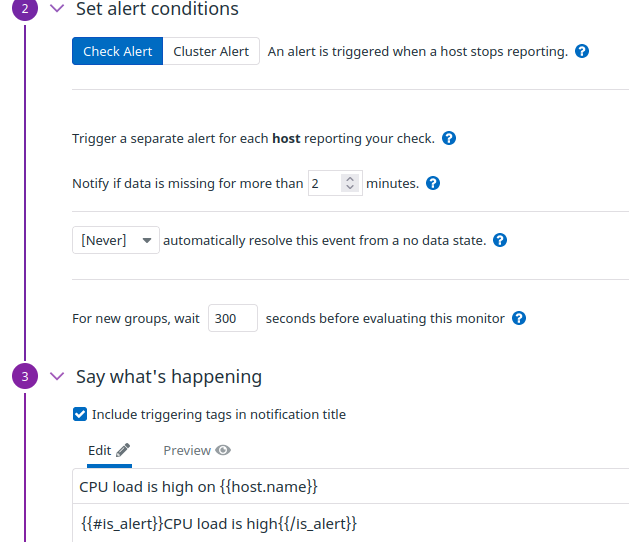
Simply set the settings according to your preference and set the seconds you want the alert to be generated for host alerts and save it at the end.
Monitor for RAM Usage
In order to check the usage of RAM, how much is available and to generate an alert in case it crossed the limit, we’ll create a metric alert:
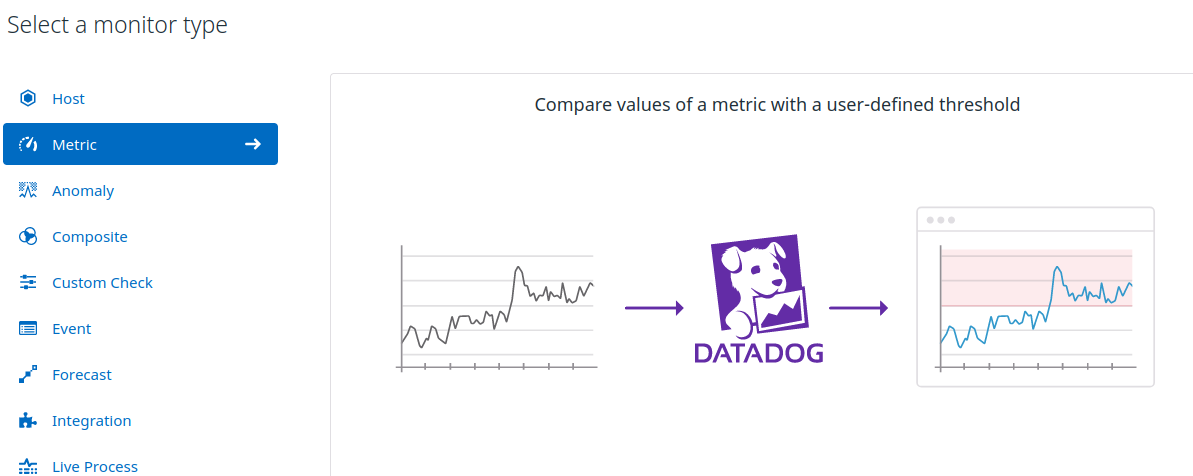
After selecting Metric it’ll provide us options with the types of alert to be generated from which we will choose “Threshold Alert”
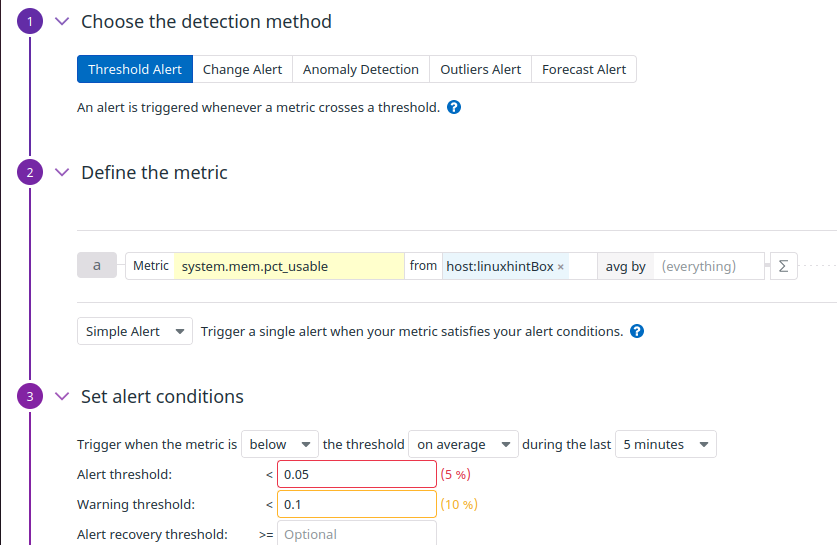
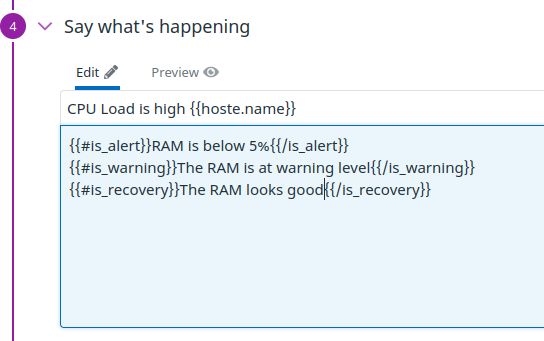
Here in the Define metric you’ve to choose “system.mem.pct_usable” and select your host. In the alert condition we simply set that whenever RAM availability is below 5%, generate an alert and save the settings. You can set the messages for various conditions as follows:
Monitor for CPU Usage
In order to alert the system whenever CPU usage crosses its threshold we’ll create another “Metric” monitor, so select the metric monitor again and set the following settings:
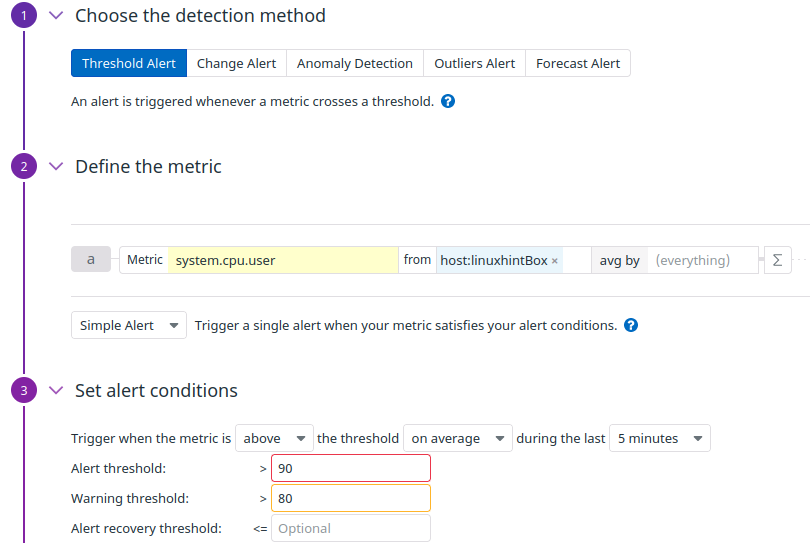
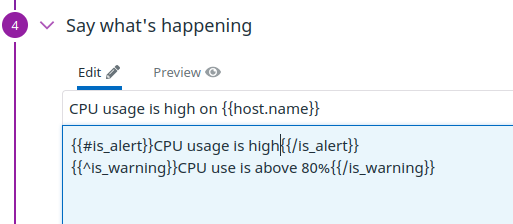
Here again the alert type is “Threshold” but this time the metric flag is “system.cpu.user” and an alert will be generated when the CPU usage will be above 90%. We’ve also set a warning to be generated when CPU use is above 80% and appropriate messages to be displayed according to the condition:
Monitor for Process
In order to keep a check on various processes running on our system or to check a particular one we will create a monitor to generate an alert. This is helpful because it tells us which process is running and which applications processes are killed. But this monitor comes with drawbacks such as sometimes the monitor doesn’t kill the process or generate an alert for the process which is not working due to their own internal faults.
In order to create a monitor for process we’ll go to the directory where datadog configuration files are stored:
![]()
Now go to the process directory:
![]()
Here we’ve a file called “conf.yaml.example” which we’ll copy and name it to “conf.yaml”:

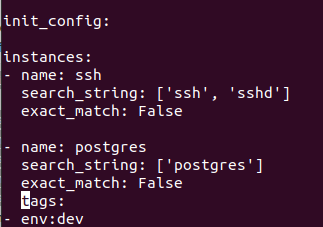
Now open the conf.yaml file and insert the following:
This will open the file in which we’ve define:
- Name: The name shows on Datadog of our process
- Search_string: A unique string that is displayed when you search for the process on your system.
- exact_match: Set it to False so that string is searched unrespectable of the formatting.
- Tag: metadata which is used to search for processes in our system.
instances:
- name: ssh
search_string: ['ssh', 'sshd']
exact_match: False
- name: postgres
search_string: ['postgres']
exact_match: False
tags:
- env:dev
Now save the file and restart the DataDog by running the below command:
![]()
After this simply run the below command to check the status of datadog which will show us status of various process, cpu usage etc:
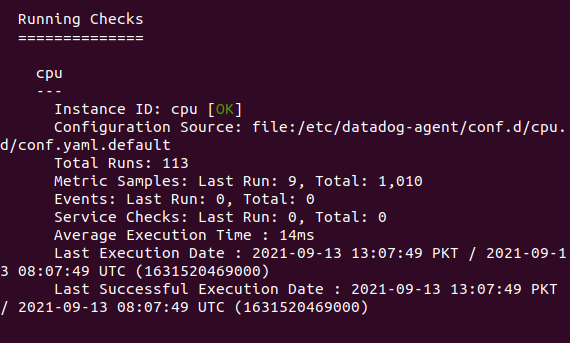
Furthermore, you can check the status of various monitors by clicking on manage monitors from the dashboard:

Conclusion
Datadog is an amazing service through which we can track the CPU usage, RAM usage and various processes running on our system. We can do this by creating monitors that give us alerts whenever a threshold on each monitor is reached. In this article we guided you how to create monitors to keep checks on various CPU usage, process running and RAM usage and provide us with warnings in order to keep our system running without encountering any problems.
from https://ift.tt/2Yy2LR8


0 Comments