In this article, I am going to talk about different parts of Prometheus and show you how to install it on Ubuntu 20.04 LTS. I will also show you its basics. So, let’s get started!
Table of Contents
- Prerequisites
- Parts of Prometheus
- Official Prometheus Exporters
- Installing Prometheus
- Installing Node Exporter
- Adding Node Exporter to Prometheus
- Using Prometheus
- Conclusion
- References
Prerequisites
To download the required files from the command line, you need to have wget installed on your computer.
You can install wget with the following command:

For security purposes, it is not a good idea to run Prometheus with super-user privileges (as user root). So, in this article, I will configure Prometheus to run as an ordinary system user prometheus.
You can create a new user prometheus with the following command:

Parts of Prometheus
Prometheus has 3 parts:
i. Prometheus
It is the main software that is used for collecting metrics from different sources and sending alerts to Alert Manager.
ii. Exporters
These are used to export metrics about the operating system, software, and services. Prometheus uses the exporters to collect metrics. It has many official exporters (i.e., Node Exporter, Blackbox Exporter, MySQLd Exporter). Each one of them is used for exporting different types of metric information.
iii. Alert Manager
Alert Manager is used for sending alerts (received from Prometheus) via email and web services. If you want to use Prometheus for monitoring only, you don’t need Alert Manager.
In this article, I will only show you how to install Prometheus and one of the exporters (Node Exporter) on your computer. I won’t show you how to configure Alert Manager. I will write a dedicated article on that topic.
Official Prometheus Exporters
The official Prometheus exporters are:
i. Node Exporter
It is used to export the hardware and OS metrics that are exposed by the Linux kernels to Prometheus.
ii. Blackbox Exporter
It is used to monitor network endpoints over the HTTP, HTTPS, DNS, ICMP, and TCP protocols.
iii. Consul Exporter
It is used to export Consul service health metrics to Prometheus.
iv. Graphite Exporter
It is used to convert metrics exported in the Graphite plaintext protocol format to the format that Prometheus can understand and export.
v. HAProxy Exporter
It is used to export HAProxy statistics for Prometheus.
vi. memcached Exporter
It is used to export memcached metrics to Prometheus.
vii. mysqld Exporter
It is used to export MySQL server statistics to Prometheus.
viii. statsd Exporter
It is used to convert StatsD-style metrics to Prometheus metrics and export them to Prometheus.
In this article, I will only cover Node Exporter. If you want to install other exporters, check the official website of Prometheus.
Installing Prometheus
You can download the latest version of Prometheus from the official website of Prometheus and install it on Ubuntu 20.04 LTS very easily.
First, navigate to the ~/Downloads directory (or any other temporary directory of your choice) as follows:

Download the latest version of Prometheus (v2.28.0 at the time of this writing) with the following command:

Prometheus is being downloaded. It may take a while to complete.
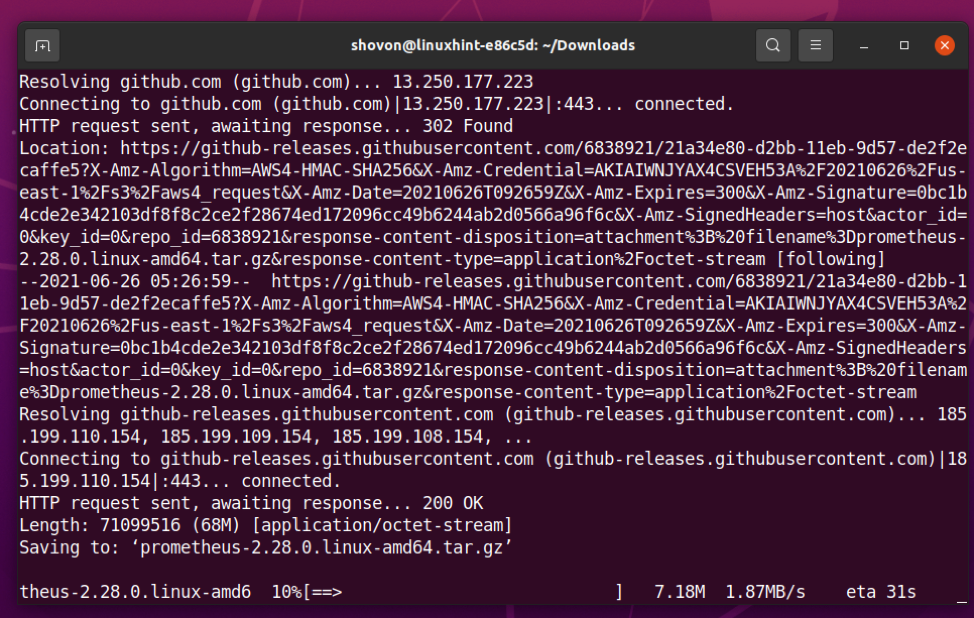
At this point, Prometheus should be downloaded.
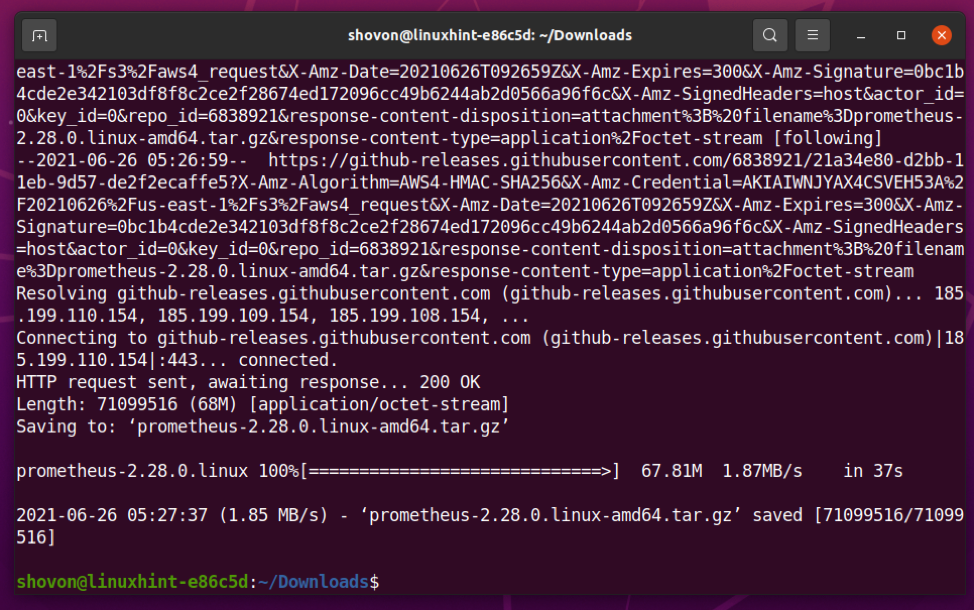
Once Prometheus is downloaded, you should find a new archive file prometheus-2.28.0.linux-amd64.tar.gz in your current working directory, as marked in the screenshot below.

Extract the prometheus-2.28.0.linux-amd64.tar.gz archive with the following command:

You should find a new directory prometheus-2.28.0.linux-amd64/, as marked in the screenshot below.

Now, move the prometheus-2.28.0.linux-amd64 directory to /opt/ directory and rename it to prometheus as follows:

Change the user and group of all the files and directories of the /opt/prometheus/ directory to root:

Fix the file and directory permissions of all the files and directories of the /opt/prometheus/ directory:

The configuration file of Prometheus is /opt/prometheus/prometheus.yml.
You can open it with the nano text editor as follows:

The default Prometheus configuration file /opt/prometheus/prometheus.yml should look as shown in the screenshot below.
The default configuration file works just fine.
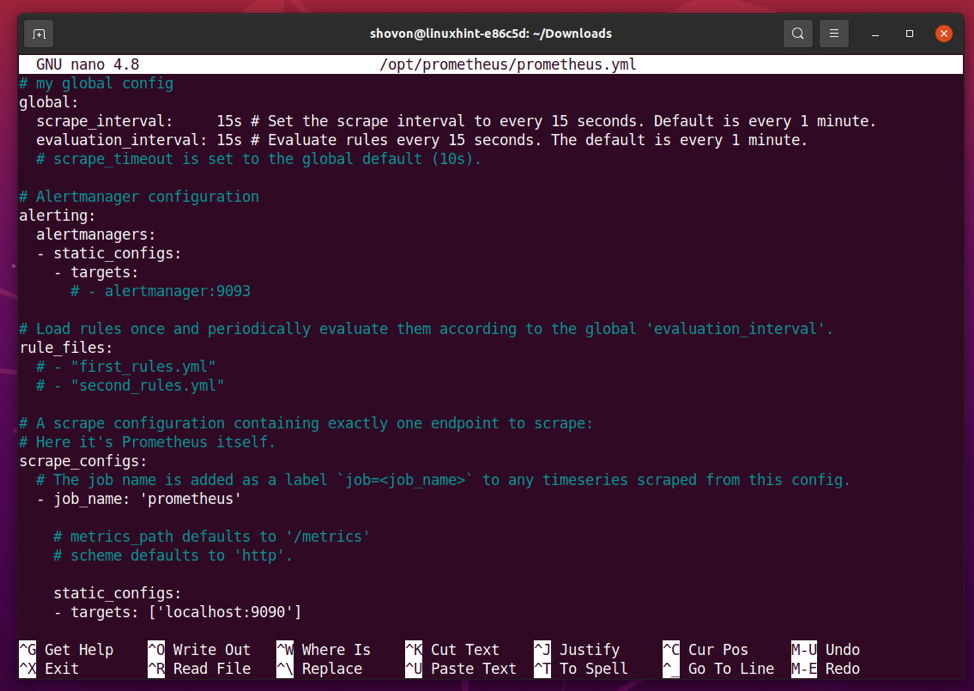
The lines starting with the # symbol are comments.
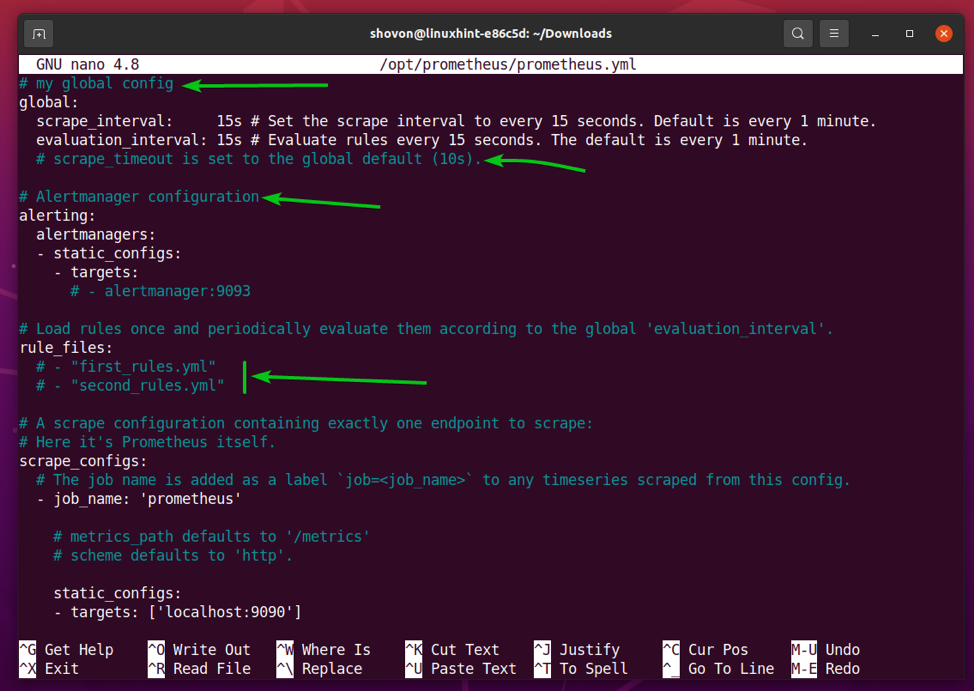
(optional) If you want, you can remove the comment lines from the configuration file /opt/prometheus/prometheus.yml with the following command:

Once all the comment lines are removed, the configuration file /opt/prometheus/prometheus.yml should look as shown in the screenshot below.
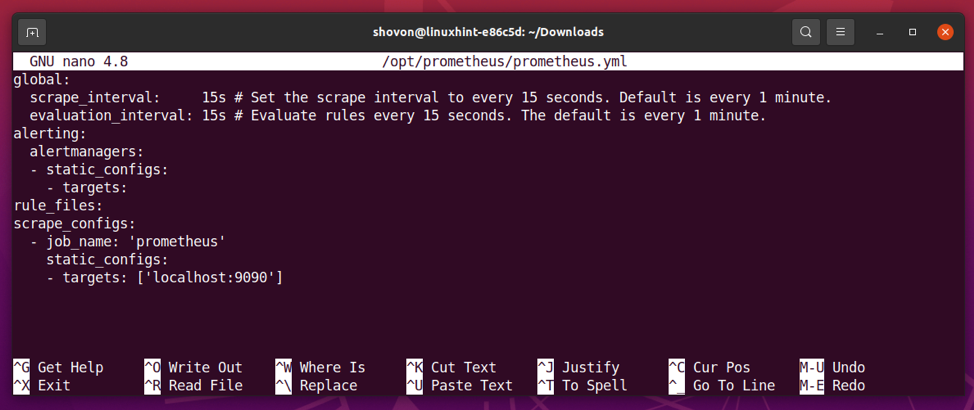
After every scrape_interval (15 seconds in this configuration) time, Prometheus will scrape data from the jobs configured in the scrape_configs section.
In the scrape_configs section, you list the targets that Prometheus will scrape data from after every scrape_interval time.
To configure a target, you need the following information:
- A It can be anything and is used to identify the target.
- The DNS name or IP address and the port number of the target in which a Prometheus exporter is available.
By default, only a single target localhost:9090 is configured for the prometheus job. Prometheus itself exports its runtime metrics on the port 9090. So, this target scrapes information about the running Prometheus instance.
After every evaluation_interval time, the rules defined in the rule_files section are evaluated and alerts are sent to the Alert Manager configured in the alerting section. Alerting and Alert Manager is out of the scope of this article. So, I will not cover them here.
Prometheus needs a directory where it can store the metrics that it had collected. In this article, I will store it in the /opt/prometheus/data/ directory.
So, create a new directory data/ in the /opt/prometheus/ directory as follows:

As you will be running Prometheus as the user prometheus, the /opt/prometheus/data/ directory must be accessible to the user prometheus.
So, change the user and group of the /opt/prometheus/data/ directory to prometheus as follows:

Now, you have to create a systemd service file for Prometheus so that you can easily manage (start, stop, restart, and add to startup) the prometheus service with systemd.
To create a systemd service file prometheus.service, run the following command:

Type in the following lines of codes in the prometheus.service file.
Description=Monitoring system and time series database
[Service]
Restart=always
User=prometheus
ExecStart=/opt/prometheus/prometheus --config.file=/opt/prometheus/prometheus.yml --storage.tsdb.path=/opt/prometheus/data
ExecReload=/bin/kill -HUP $MAINPID
TimeoutStopSec=20s
SendSIGKILL=no
LimitNOFILE=8192
[Install]
WantedBy=multi-user.target
Once you’re done, press <Ctrl> + X followed by Y and <Enter> to save the prometheus.service file.

For the systemd changes to take effect, run the following command:

Now, start the prometheus service with the following command:

Add the prometheus service to the system startup, so that it automatically starts on boot with the following command:

As you can see, the prometheus service is active/running. It is also enabled (will start automatically on boot).
Now, find the IP address of your computer with the following command:

As you can see, the IP address of my computer is 192.168.20.131. It will be different for you. So, make sure to replace it with yours from now on.

Open your favorite web browser and visit http://192.168.20.131:9090/graph. Your browser should load the Prometheus Graph page, as you can see in the screenshot below.
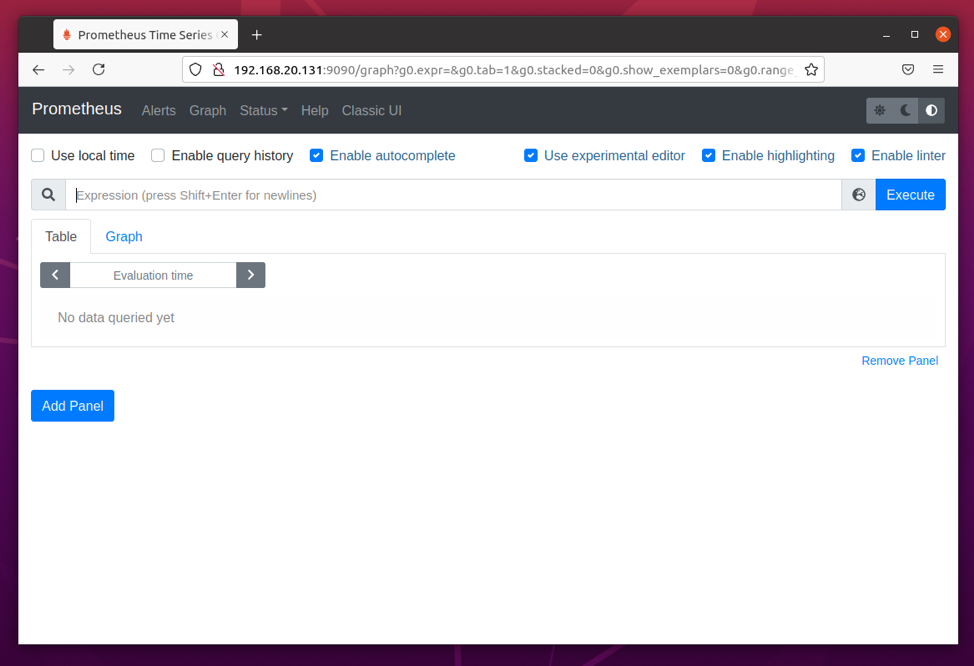
Navigate to the URL http://192.168.20.131:9090/targets from your favorite web browser and all the targets that you’ve configured should be displayed. Shown here that the prometheus target is in the UP state.

Installing Node Exporter
Node Exporter is used for exporting hardware and operating system metrics that are exposed by the Linux kernel to Prometheus. In this section, I am going to show you how to download the latest version of Node Exporter and install it on Ubuntu 20.04 LTS.
First, navigate to the ~/Downloads directory as follows:

Download the latest version of Node Exporter (v1.1.2 at the time of this writing) with the following command:

Node Exporter is being downloaded. It may take a while to complete.

At this point, Node Exporter should be downloaded.
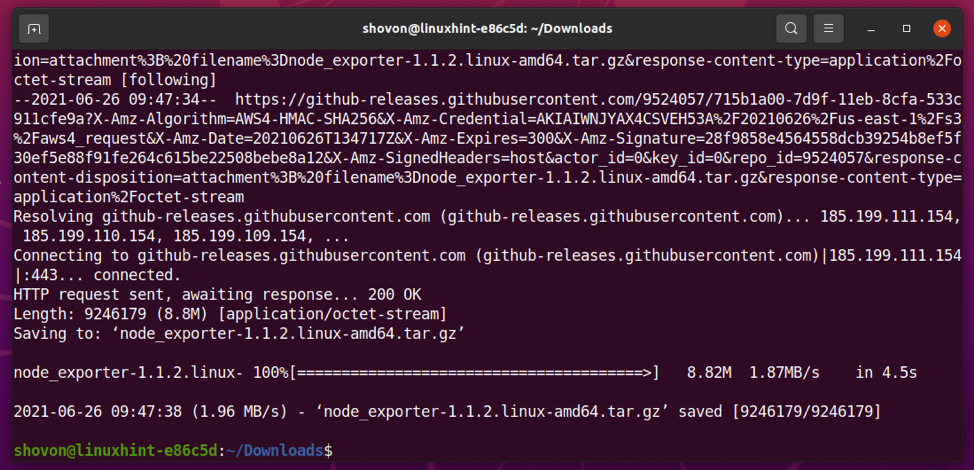
Once Node Exporter is downloaded, you should find a new archive file node_exporter-1.1.2.linux-amd64.tar.gz in your current working directory, as marked in the screenshot below.

Extract the node_exporter-1.1.2.linux-amd64.tar.gz archive in your current working directory with the following command:

A new directory node_exporter-1.1.2.linux-amd64/ should be created, as marked in the screenshot below.

In the node_exporter-1.1.2.linux-amd64/ directory, you should find the node_exporter binary file.

Move the node_exporter binary file from the node_exporter-1.1.2.linux-amd64/ directory to the /usr/local/bin/ directory as follows:

Also, change the user and group of the /usr/local/bin/node_exporter binary file to root as follows:

Node Exporter should be installed.
Now, you should be able to run node_exporter just like any other command.

Now, you have to create a systemd service file for Node Exporter so that you can easily manage (start, stop, restart, and add to startup) the node-exporter service with systemd.
To create a systemd service file node-exporter.service, run the following command:

Type in the following lines of codes in the node-exporter.service file.
Description=Prometheus exporter for machine metrics
[Service]
Restart=always
User=prometheus
ExecStart=/usr/local/bin/node_exporter
ExecReload=/bin/kill -HUP $MAINPID
TimeoutStopSec=20s
SendSIGKILL=no
[Install]
WantedBy=multi-user.target
Once you’re done, press <Ctrl> + X followed by Y and <Enter> to save the node-exporter.service file.
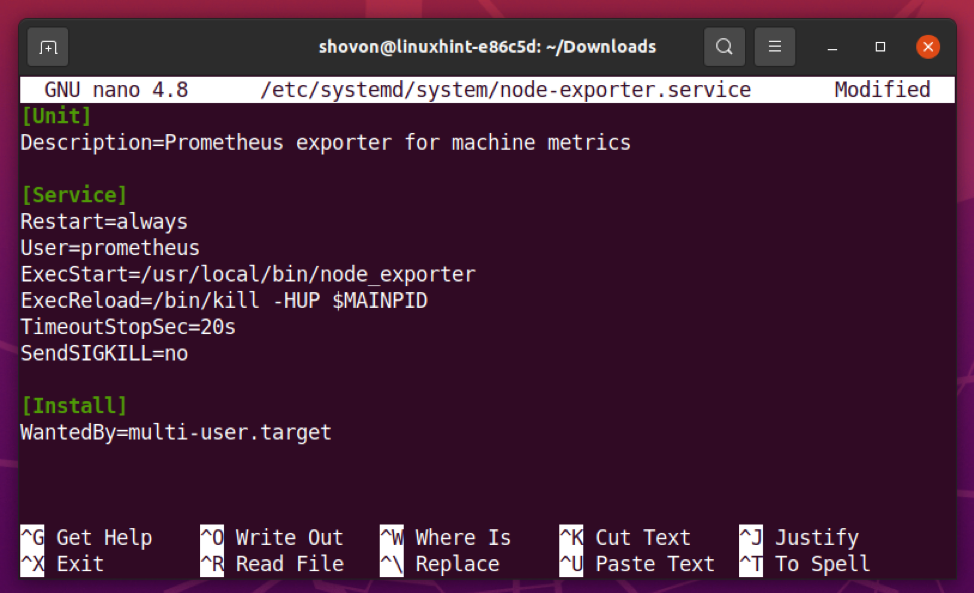
For the systemd changes to take effect, run the following command:

Now, start the node-exporter service with the following command:

Add the node-exporter service to the system startup so that it automatically starts on boot with the following command:

As you can see, the node-exporter service is active/running. It is also enabled (will start automatically on boot).

Now, find the IP address of the computer where you have installed Node Exporter with the following command:

As you can see, the IP address of my computer is 192.168.20.131. It will be different for you. So, make sure to replace it with yours from now on.

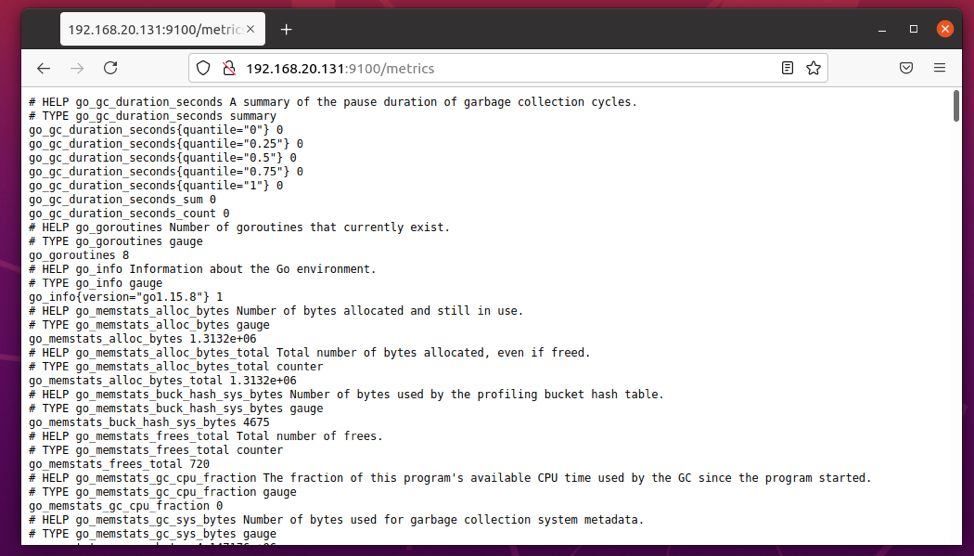
To check whether Node Exporter is working, visit the URL http://192.168.20.131:9100/metrics from your favorite web browser. If everything goes well, you should see the page, as shown in the screenshot below.
Adding Node Exporter to Prometheus
Once you have installed Node Exporter on the computer that you want to monitor with Prometheus, you have to configure Prometheus so that it collects metrics from that computer. All you have to do is add the computer where you’ve installed Node Exporter as a target on Prometheus.
To do that, open the prometheus.yml configuration file as follows:

Add the following lines in the scrape_configs section of prometheus.yml file. Make sure to indent everything correctly to avoid syntax errors.
static_configs:
- targets: ['192.168.20.131:9100']
Once you’re done, press <Ctrl> + X followed by Y and <Enter> to save the prometheus.yml file.

Here, the job_name is node_exporter and the target is 192.168.20.131:9100 (as Node Exporter is running on port 9100).
If you want to monitor multiple servers with Prometheus, you will have to install Node Exporter on each one of them and create a new job for each one of them. In that case, you can use the hostname of your server as its job name to make identifying each target easier.
For the changes to take effect, restart Prometheus with the following command:

Now, visit the URL http://192.168.20.131:9090/targets from your favorite web browser and you should see a new entry node_exporter, as marked in the screenshot below. Click on show more.
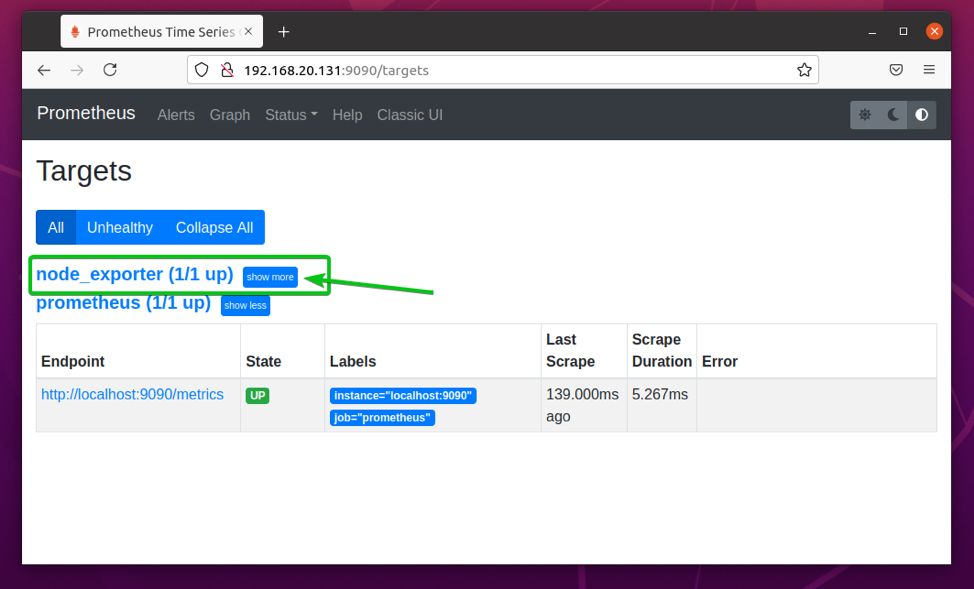
As you can see, the node_exporter target is in the UP state. So, Node Exporter is working just fine and Prometheus can collect metrics from the computer where you’ve installed Node Exporter.

Using Prometheus
In this section, I am going to show you how to use Prometheus to monitor the network traffic of your computer (where you have installed Node Exporter). This should help you get a basic idea of how Prometheus works.
First, navigate to the Prometheus Graph page (http://192.168.20.131:9090) from your favorite web browser.
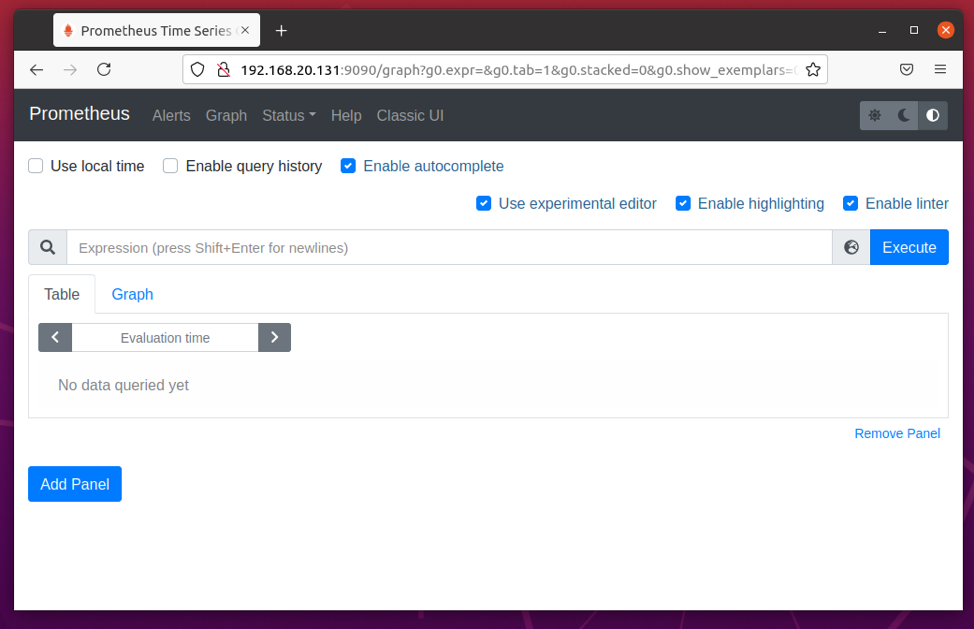
In the Expression section, type in Prometheus expressions and click on Execute to execute them.
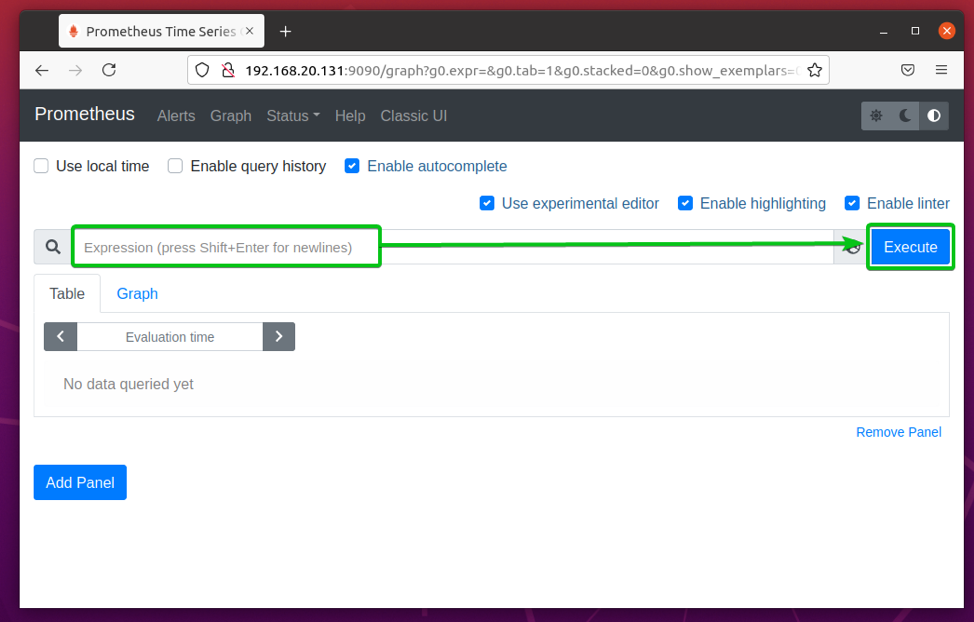
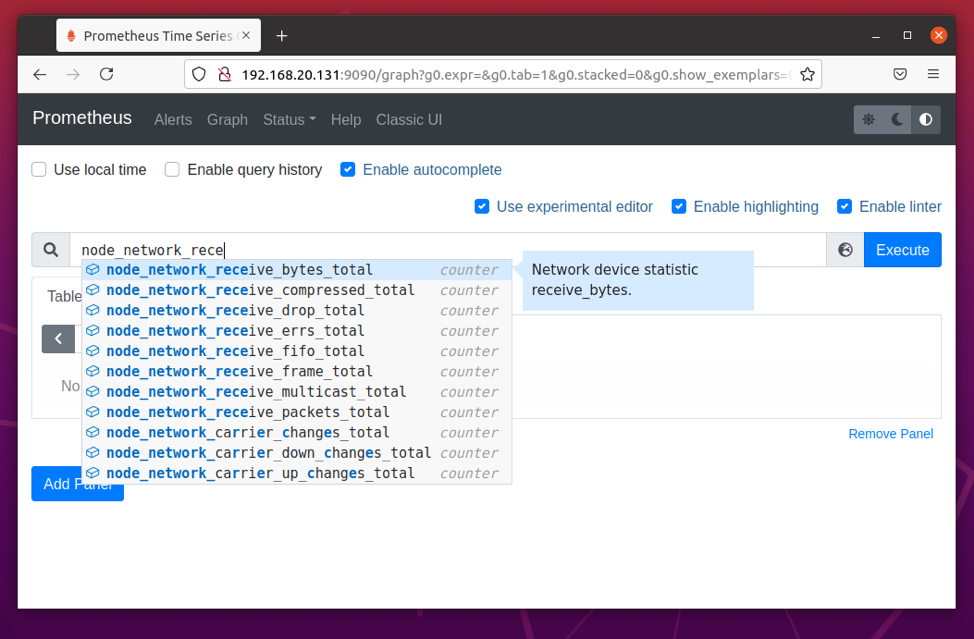
Once you start typing Prometheus expression, you should get autocompletion, as you can see in the screenshot below.
The properties exported by Node Exporter starts with node_.
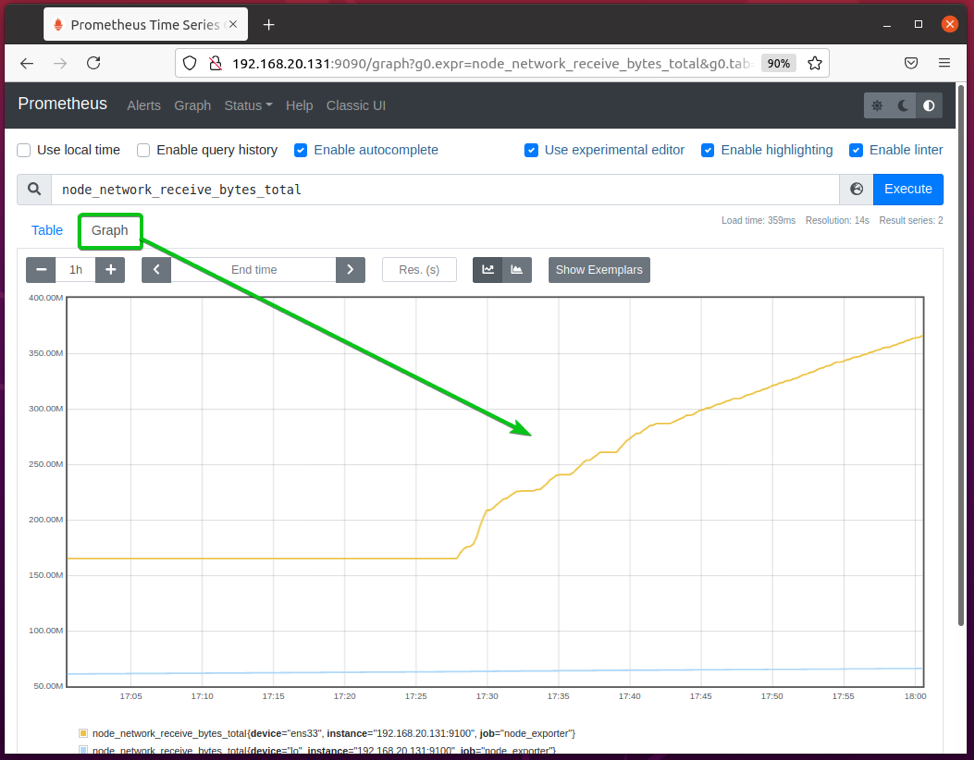
To monitor the total bytes received (downloaded) by the computer, type in node_network_receive_bytes_total and click on Execute.
On the Table tab, the current value of your selected property should be displayed.

To see the graph of your selected property, click on the Graph tab.
The node_network_receive_bytes_total is a counter. So, it contains the value of the total received/downloaded bytes. A counter will keep increasing; It will never decrease. This is what you’re seeing in this graph.
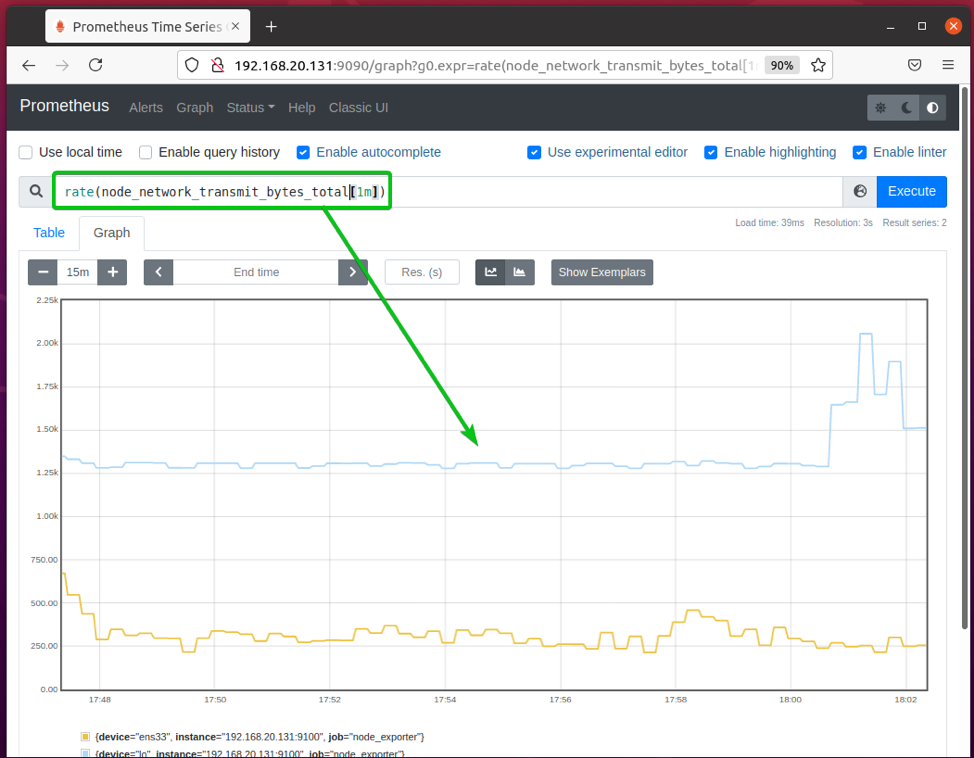
You can see the download speed (the bytes received/downloaded per second) of your computer using the rate() function on the node_network_receive_bytes_total counter.
To do that, type in the expression rate (node_network_receive_bytes_total[1m]) and click on Execute. The graph should display how many bytes of data your computer received per second, as you can see in the screenshot below.

You can click on the + and the – icon to adjust the timeline of the graph. This should help you observe how a property changes over a certain amount of time.

In the same way, you can use the rate (node_network_transmit_bytes_total[1m]) expression to display the number of bytes your computer uploaded per second.
Conclusion
In this article, I have shown you how to install the latest version of Prometheus and Node Exporter on Ubuntu 20.04 LTS. I have also shown you how to create systemd service files for Prometheus and Node Exporter. Other than that, how to use Prometheus to monitor the network traffic of your computer is discussed here as well. This article should help you get started with Prometheus.
References
[1] Prometheus – Monitoring system & time series database
[2] Download | Prometheus
[3] Ubuntu 20.04 LTS prometheus systemd file
[4] Prometheus Ubuntu man page
[5] Ubuntu 20.04 LTS prometheus-node-exporter systemd file
from Linux Hint https://ift.tt/2VHZNIf


0 Comments