


Sentiment analysis is a way to predict what the behind of the text (reviews or comments) means, whether it means positive, negative, or neutral. Sentiment analysis is another feature of the NLP. Most of the companies want to know about the feedback of their products from the customers. So, they asked customers to fill the feedback form, comments on the ads (Facebook, Twitter, etc.). Then the companies collect these feedbacks or comments to figure out what the customer thinks about the company products, and on behalf of that, the companies will target the customers.
We can understand the sentiment analysis from the following example:
- Artificial Intelligence is the future.
- Artificial Intelligence is not only the future.
- Artificial intelligence people get a good salary.
So, from the above three phrases, we can find out that the first phrase has positive feedback about the future of AI and the second phrase has some negative points about AI. They told the third phrase saying nothing about the future; instead, about the salary. So, it is just; we can say that neutral about the feedback of AI.
Problem Statement:
In this sentiment analysis problem, we will solve the Kaggle website (Amazon Fine Food Reviews dataset) problem. The dataset we can download from this link: https://ift.tt/3ylr5Tz.
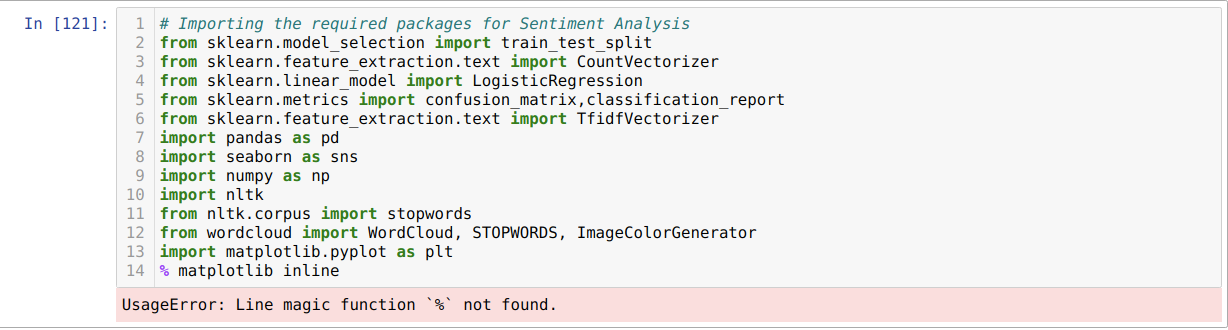
1. We are importing all the required libraries. In this program, we import the NLTK also, which is required for text normalization. We also import scikit-learn, which is a very famous machine learning library.
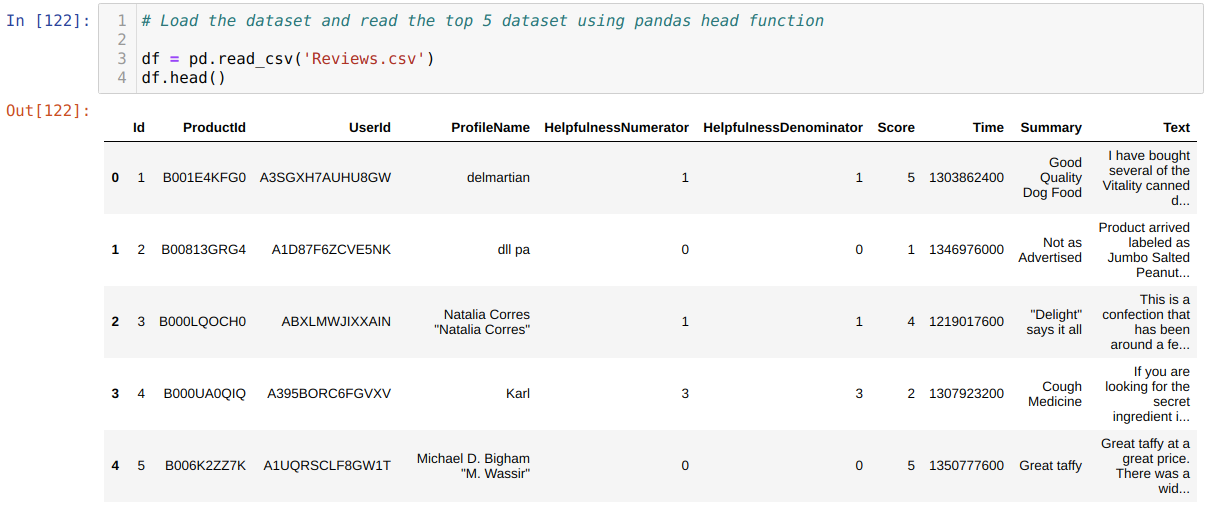
2. Now, we import our dataset (Reviews.csv) using the pandas’ function read_csv. And read the top 5 rows using the pandas head function.
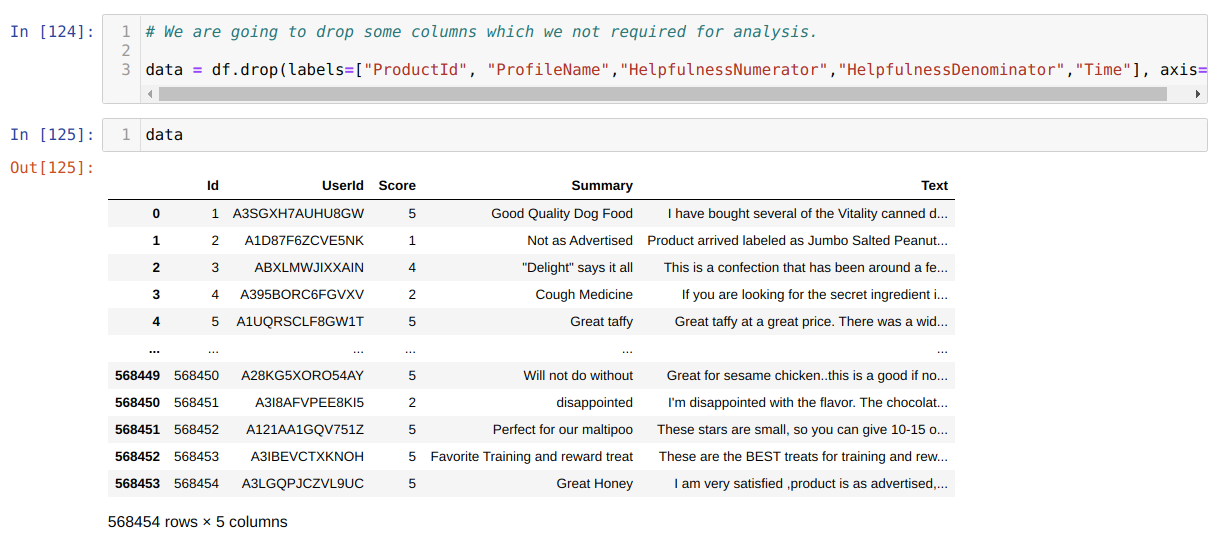
3. Now, we will drop some of the unwanted columns because those columns are not important to the analysis. In this way, our processing of the data will take less time because of a few columns. So, we will use the data frame drop method to drop the non-importance columns from the dataset. Now, we can see that our new data frame (data) has very few columns.
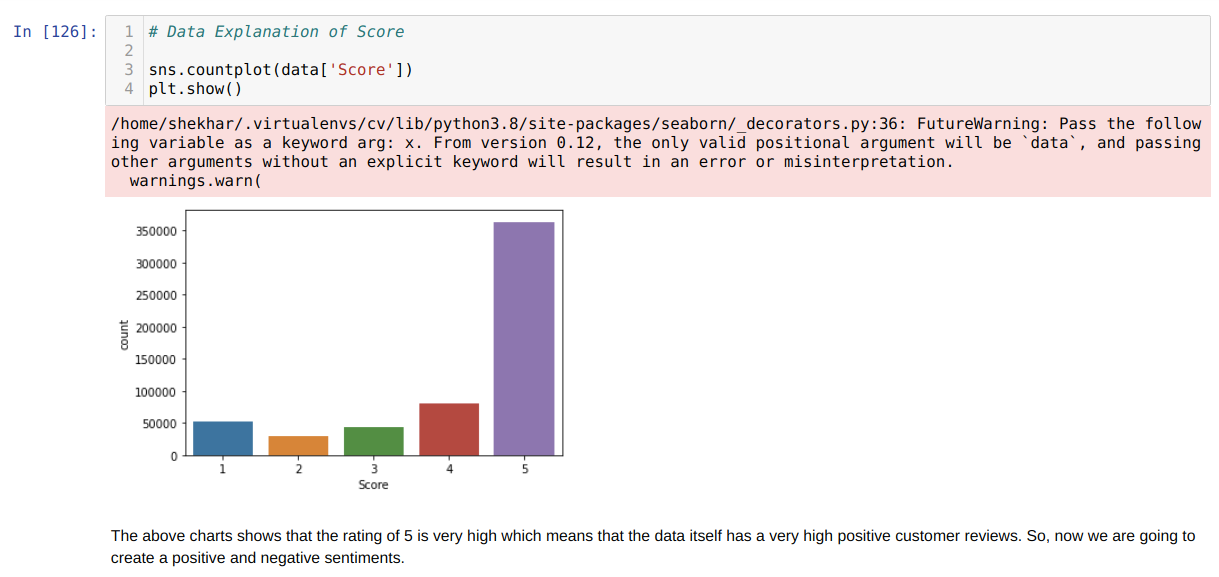
4. Now, we have very few columns in the data frame (data). Now, we want to check different ratings of the Amazon food (Score column). Because this way, we can find out either the majority of the people’s responses are positive or negative. So from the chart given below, we can say that most people gave a positive response. And also decided to remove all ratings from 1 to 5 and keep 1 for the positive response and 0 for the negative response. Anyone whose value > =3 becomes positive (1), and all those below the 3 will become negative (0). We also eliminate the value of 3 because we assume this might be a neutral response.
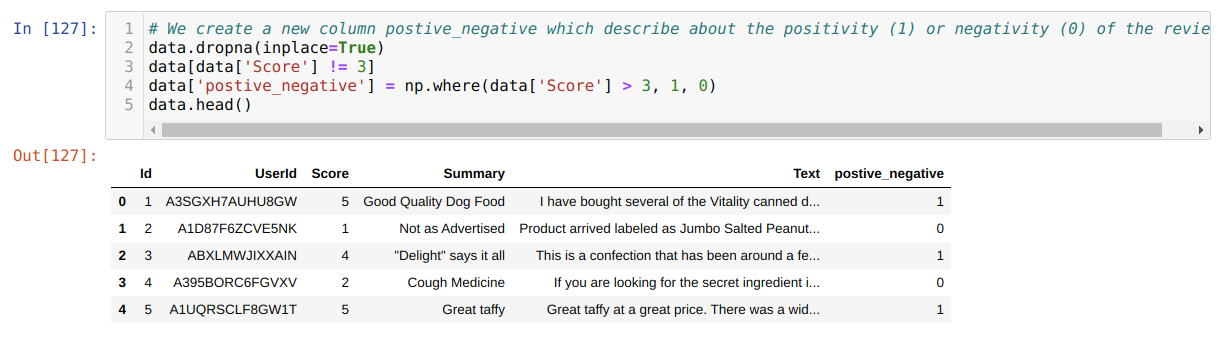
5. Now, as we said in the previous step, we will change the whole ratings to 1 or 0 and then printing the new data frame where we can see that new column name positive_negative whose values are either 1 or 0.
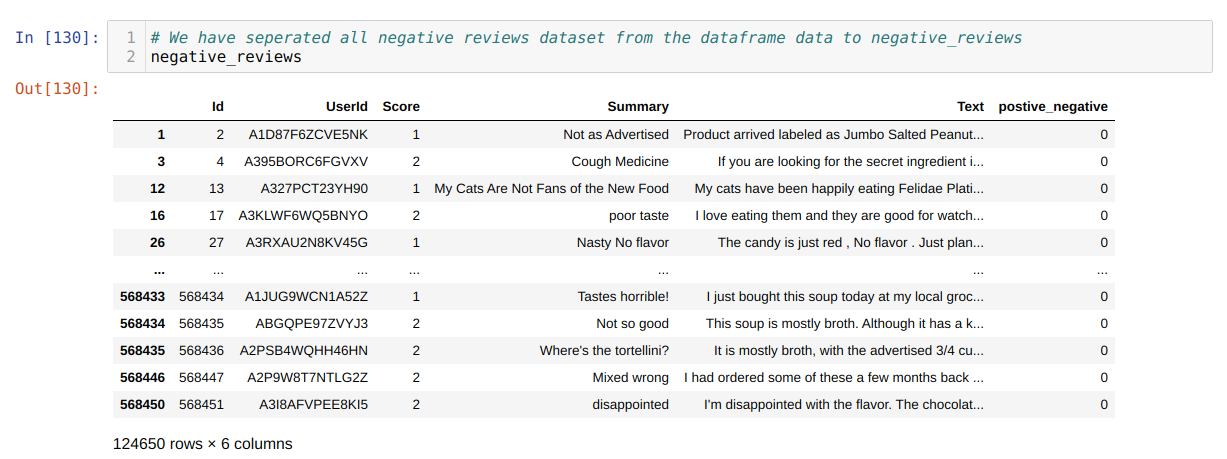
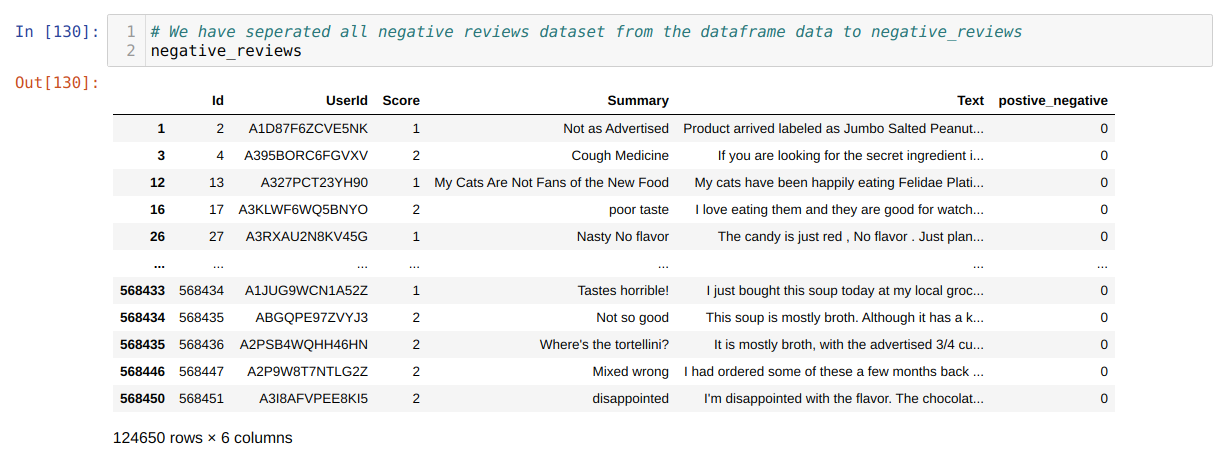
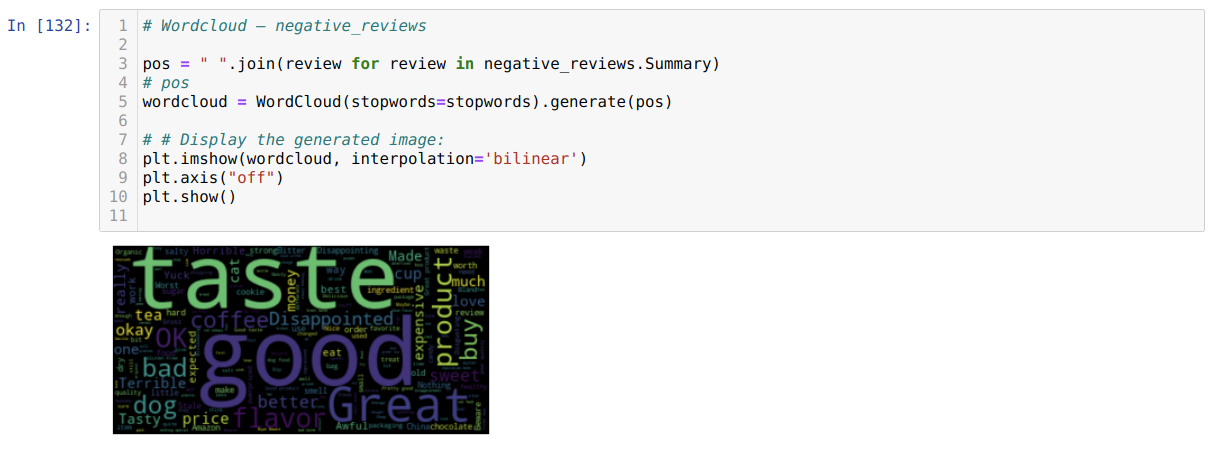
6. Now, we are going to see which words most frequently come in the reviews. For that, we will be using WordCloud. To create the wordcloud, we need to separate the positive or negative reviews; else, it will be a mix. So, we separated the negative or positive reviews dataset as shown below:
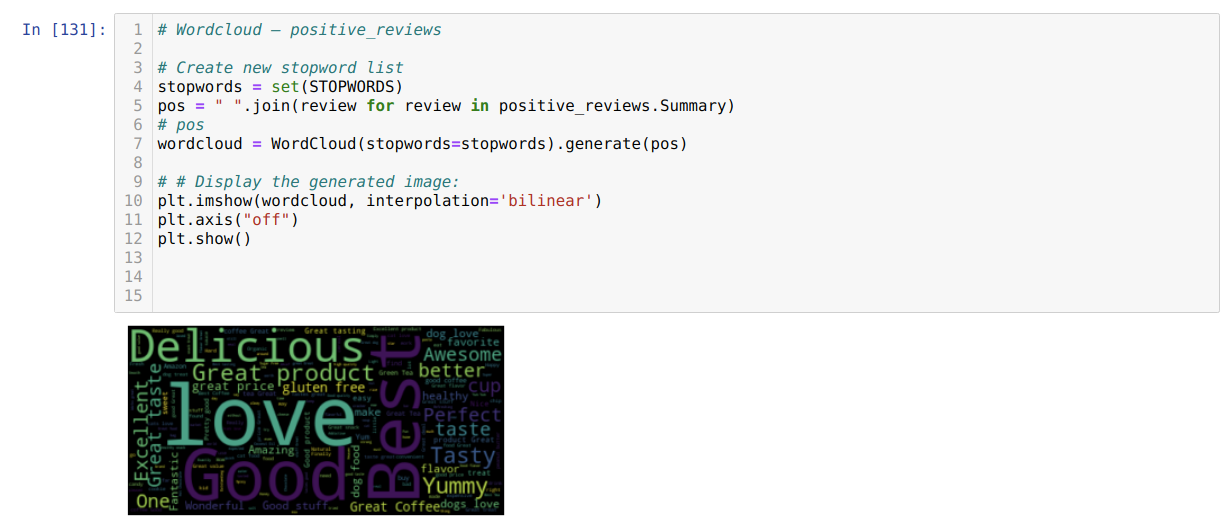
7. Now, we created the cluster of the most frequently used words in both (positive and negative) reviews.
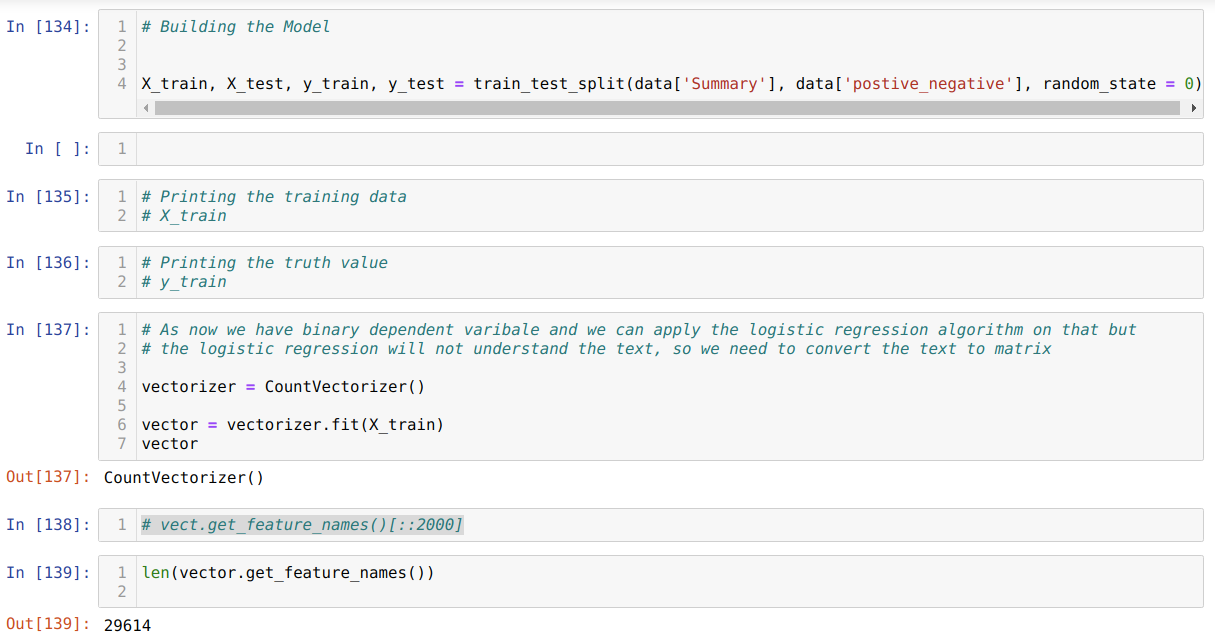
8. Now, we are going to split the whole dataset into a training and test dataset. But for this, we choose only two columns (Summary and positive_negative). After that, we create the vectorization and pass the training dataset into that because the logistic regression needs the mathematical forms of the data and not the text as shown below:
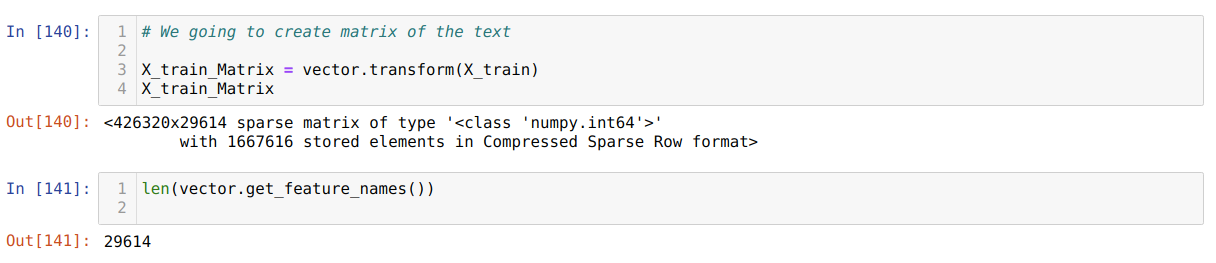
9. In the previous step, we created the vector, and now we are going to create a text matrix with the help of this vector as shown below:
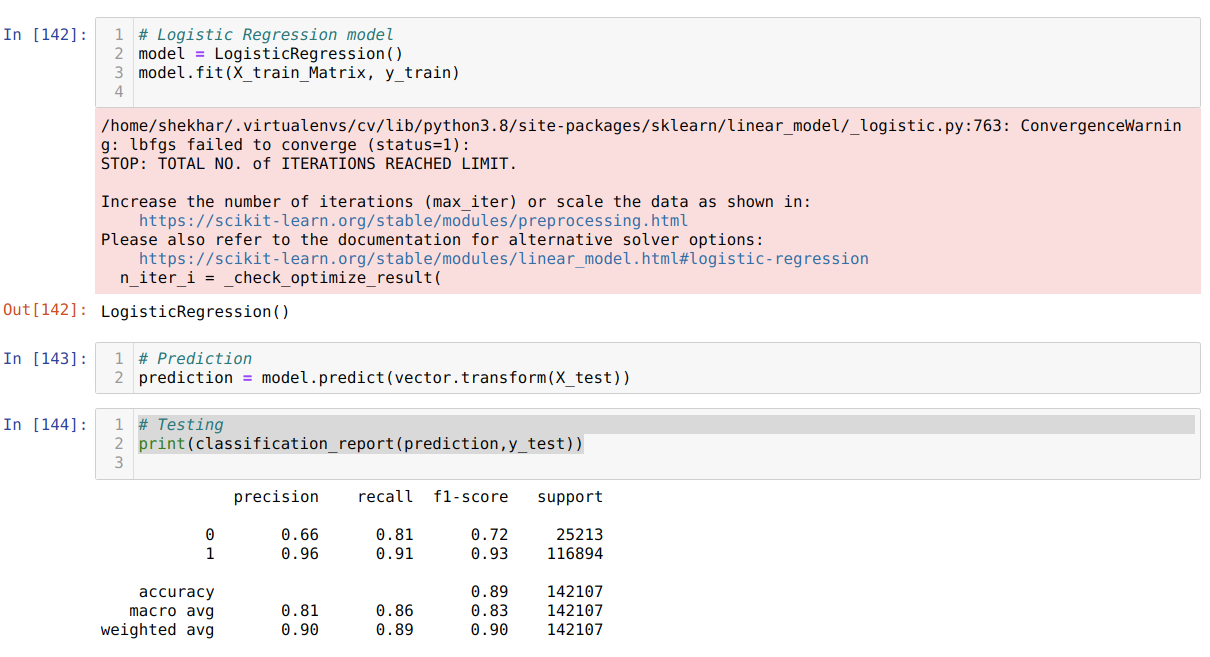
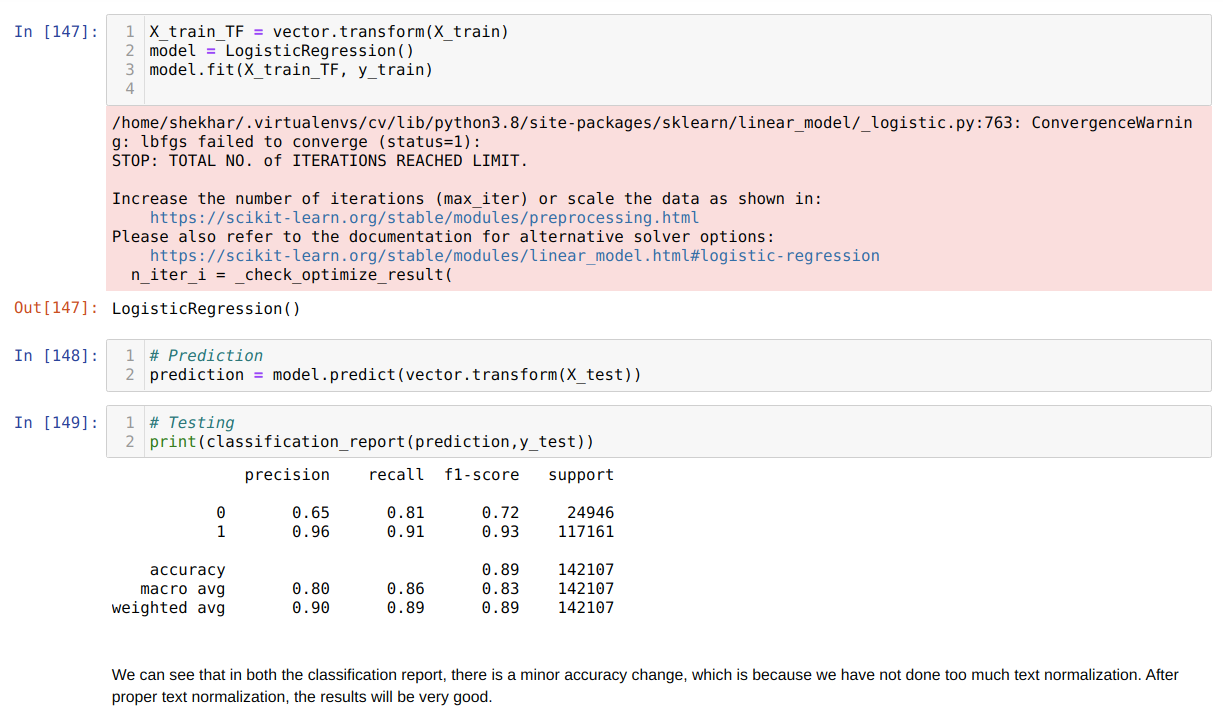
10. Now, we create the Logistic Regression object and fit the matrix form training data. Then we predict the X_test data, but before that, we also convert the X_test data into the text to the matrix using the vector object we created before. We also print the classification report, which shows that 89% accuracy.
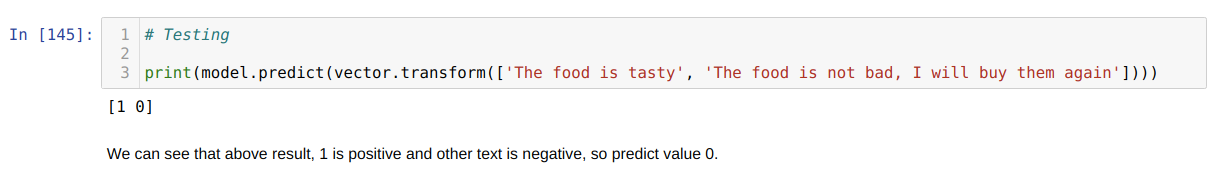
11. We passed new test data into the prediction and got the result [1 0] which shows the first review is positive and another review is negative. According to our passed new text test, data results come accurately.
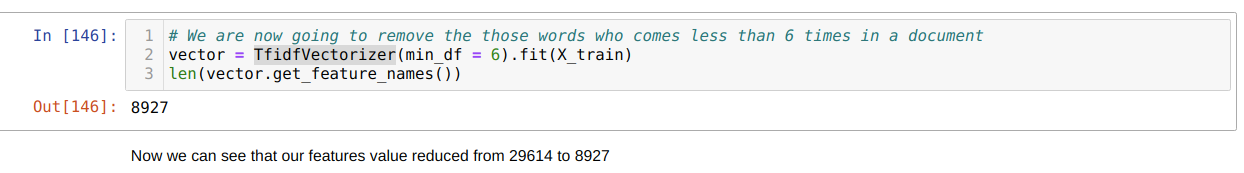
12. For better results, we can normalize the text data and clean the text data before passing it to the vectorization. So, we perform a small test here using the TfidfVectorizer library. Here we remove all those words which are occurring in less than 6 documents. In this way, the value of our feature will also go down as shown below and process the new vector object as in the previous step.
The code for this blog, along with the dataset, is available at the following link: https://github.com/shekharpandey89/sentiment-analysis
from Linux Hint https://ift.tt/33StM1b


0 Comments