Before using panda’s pivot table, make sure you understand your data and questions you are trying to solve through the pivot table. By using this method, you can produce powerful results. We will elaborate in this article, how to create a pivot table in pandas python.
Read Data from Excel file
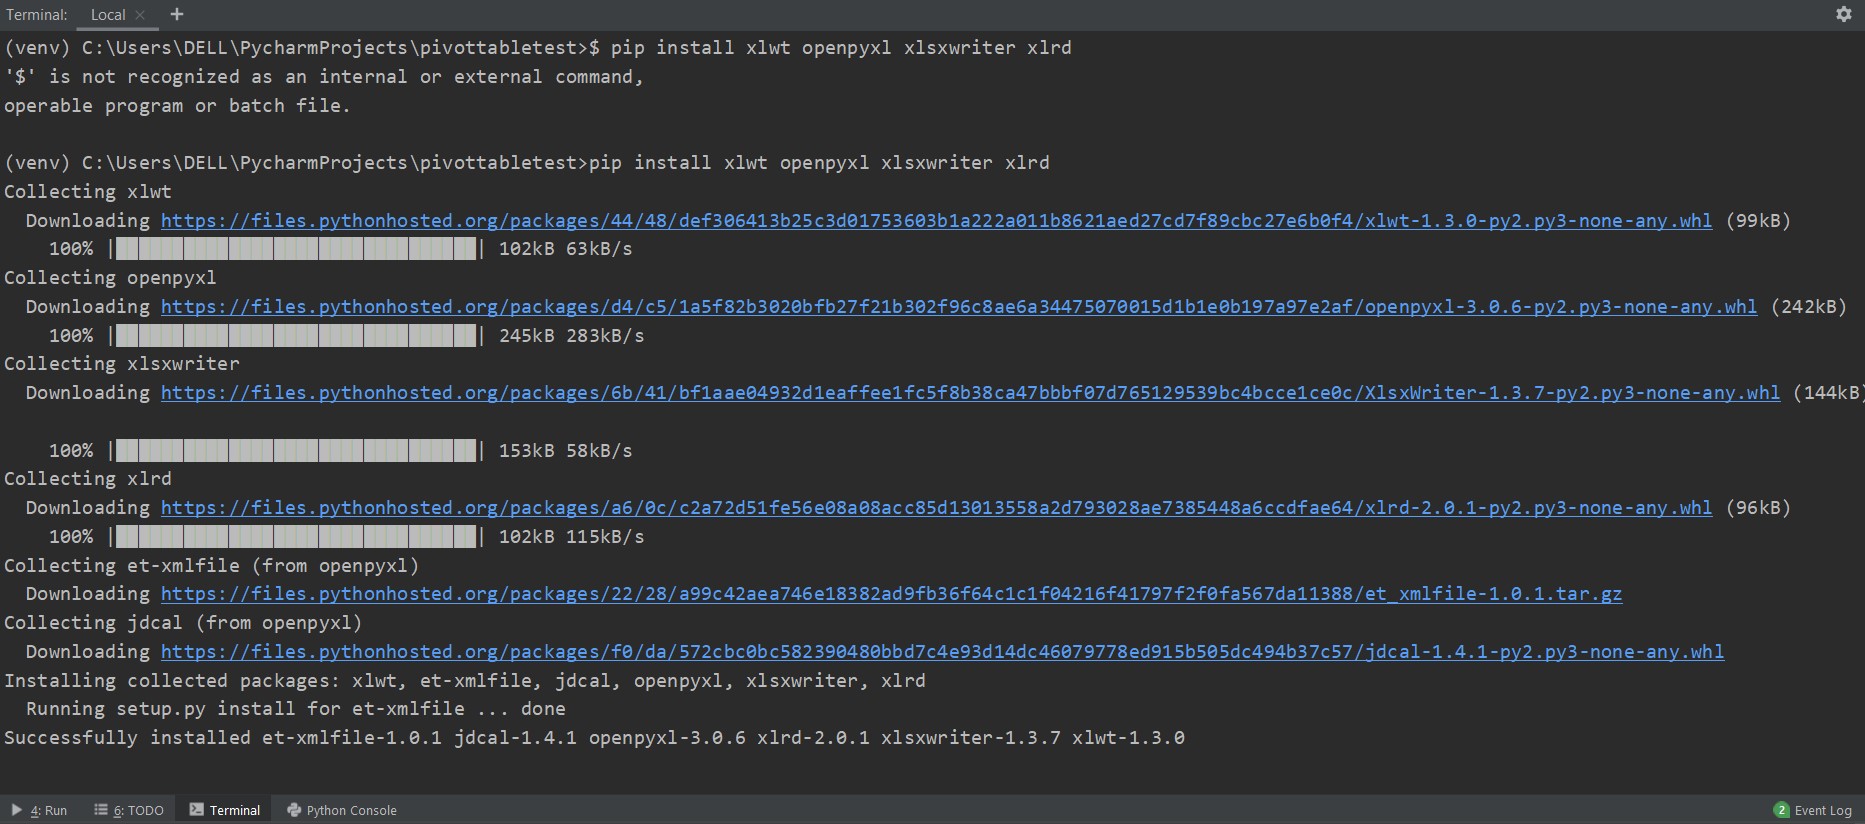
We have downloaded an excel database of food sales. Before starting the implementation, you need to install some necessary packages for reading and writing the excel database files. Type the following command in the terminal section of your pycharm editor:
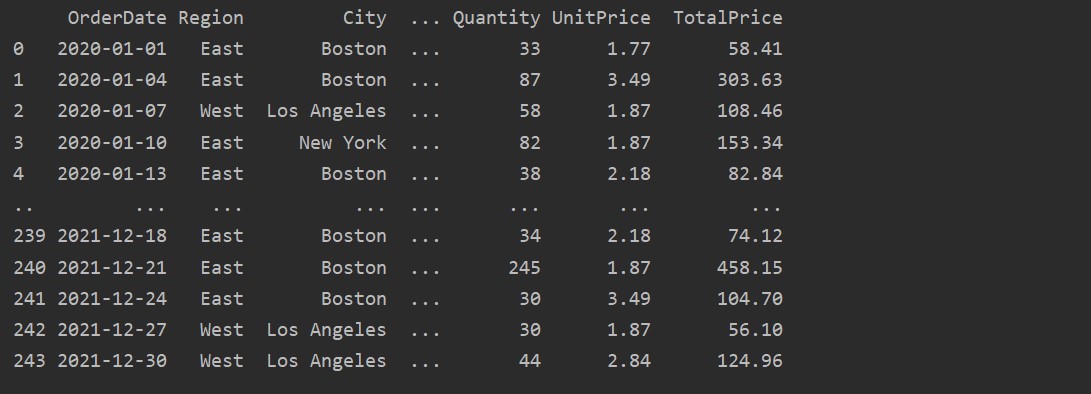
Now, read data from the excel sheet. Import the required panda’s libraries and change the path of your database. Then by running the following code, data can be retrieved from the file.
import numpy as np
dtfrm = pd.read_excel('C:/Users/DELL/Desktop/foodsalesdata.xlsx')
print(dtfrm)
Here, the data is read from the food sales excel database and passed into the dataframe variable.
Create Pivot Table using Pandas Python
Below we have created a simple pivot table by using the food sales database. Two parameters are required to create a pivot table. The first one is data that we have passed into the dataframe, and the other is an index.
Pivot Data on an Index
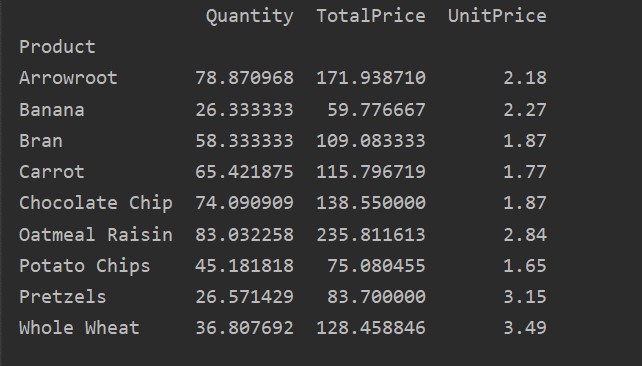
The index is the feature of a pivot table that allows you to group your data based on requirements. Here, we have taken ‘Product’ as the index to create a basic pivot table.
import numpy as np
dataframe = pd.read_excel('C:/Users/DELL/Desktop/foodsalesdata.xlsx')
pivot_tble=pd.pivot_table(dataframe,index=["Product"])
print(pivot_tble)
The following result shows after running the above source code:
Explicitly define columns
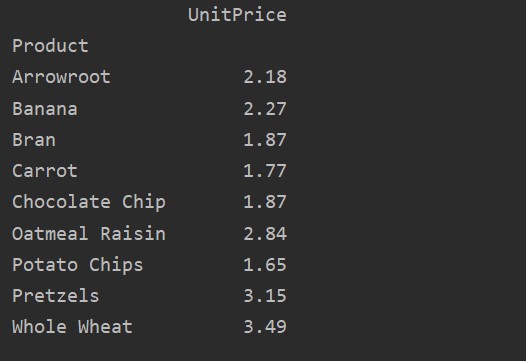
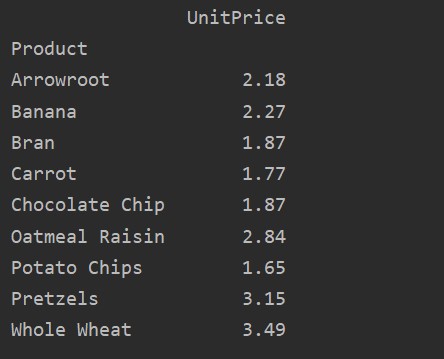
For more analysis of your data, explicitly define the column names with the index. For example, we want to display the only UnitPrice of each product in the result. For this purpose, add the values parameter in your pivot table. The following code gives you the same result:
import numpy as np
dataframe = pd.read_excel('C:/Users/DELL/Desktop/foodsalesdata.xlsx')
pivot_tble=pd.pivot_table(dataframe, index='Product', values='UnitPrice')
print(pivot_tble)
Pivot Data with Multi-index
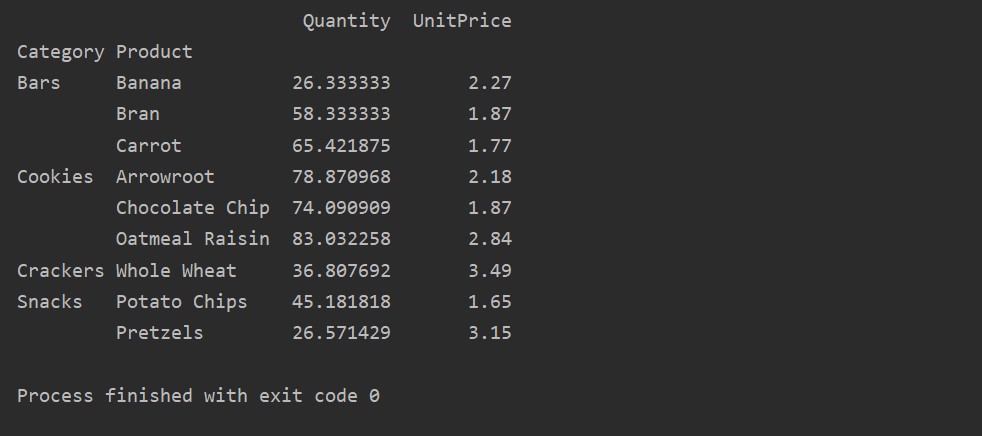
Data can be grouped based on more than one feature as an index. By using the multi-index approach, you can get more specific results for data analysis. For example, products come under different categories. So, you can display the ‘Product’ and ‘Category’ index with available ‘Quantity’ and ‘UnitPrice’ of each product as follows:
import numpy as np
dataframe = pd.read_excel('C:/Users/DELL/Desktop/foodsalesdata.xlsx')
pivot_tble=pd.pivot_table(dataframe,index=["Category","Product"],values=["UnitPrice", "Quantity"])
print(pivot_tble)
Applying Aggregation Function in Pivot table
In a pivot table, the aggfunc can be applied for different feature values. The resultant table is the summarization of feature data. The aggregate function applies to your group data in pivot_table. By default aggregate function is np.mean(). But, based on user requirements, different aggregate functions can apply for different data features.
Example:
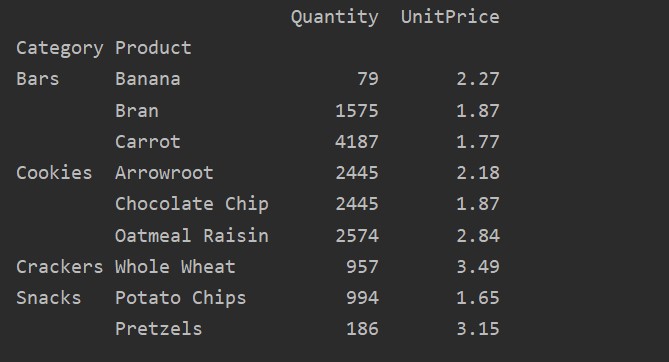
We have applied aggregate functions in this example. The np.sum() function is used for ‘Quantity’ feature and np.mean() function for ‘UnitPrice’ feature.
import numpy as np
dataframe = pd.read_excel('C:/Users/DELL/Desktop/foodsalesdata.xlsx')
pivot_tble=pd.pivot_table(dataframe,index=["Category","Product"], aggfunc={'Quantity': np.sum,'UnitPrice': np.mean})
print(pivot_tble)
After applying the aggregation function for different features, you will get the following output:
Using the value parameter, you can also apply aggregate function for a specific feature. If you will not specify the feature’s value, it aggregates your database’s numerical features. By following the given source code, you can apply the aggregate function for a specific feature:
import numpy as np
dataframe = pd.read_excel('C:/Users/DELL/Desktop/foodsalesdata.xlsx')
pivot_tble=pd.pivot_table(dataframe, index=['Product'], values=['UnitPrice'], aggfunc=np.mean)
print(pivot_tble)
Different between Values vs. Columns in Pivot Table
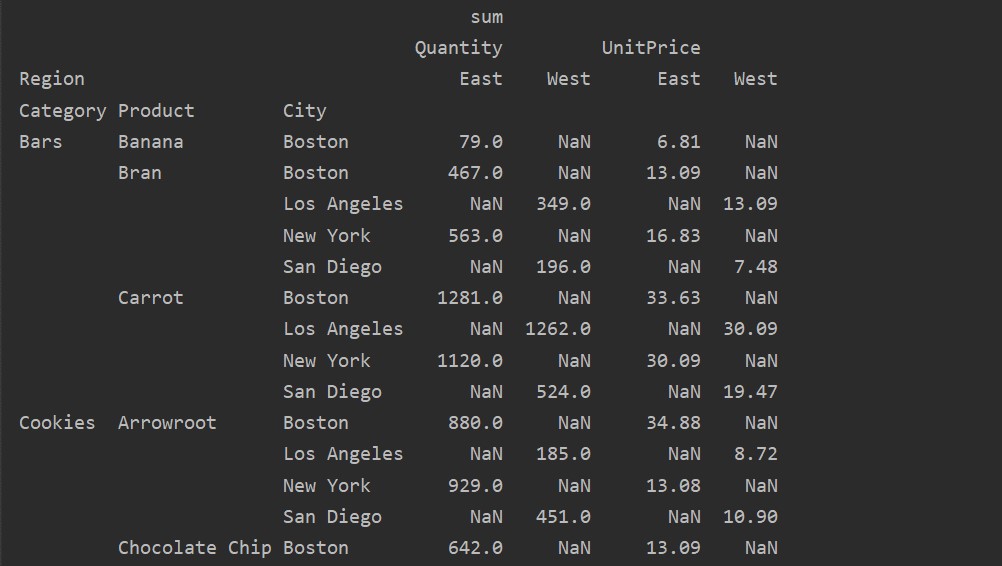
The values and columns are the main confusing point in the pivot_table. It is important to note that columns are optional fields, displaying the resultant table’s values horizontally on the top. The aggregation function aggfunc applies to the values field which you list.
import numpy as np
dataframe = pd.read_excel('C:/Users/DELL/Desktop/foodsalesdata.xlsx')
pivot_tble=pd.pivot_table(dataframe,index=['Category','Product', 'City'],values=['UnitPrice', 'Quantity'],
columns=['Region'],aggfunc=[np.sum])
print(pivot_tble)
Handling Missing Data in Pivot Table
You can also handle the missing values in the Pivot table by using the ‘fill_value’ Parameter. This allows you to replace the NaN values with some new value which you provides to fill.
For example, we removed all null values from the above resultant table by running the following code and replaces the NaN values with 0 in the whole resultant table.
import numpy as np
dataframe = pd.read_excel('C:/Users/DELL/Desktop/foodsalesdata.xlsx')
pivot_tble=pd.pivot_table(dataframe,index=['Category','Product', 'City'],values=['UnitPrice', 'Quantity'],
columns=['Region'],aggfunc=[np.sum], fill_value=0)
print(pivot_tble)

Filtering in Pivot Table
Once the result is generated, you can apply the filter by using the standard dataframe function. Let’s take an example. Filter those products whose UnitPrice is less than 60. It displays those products whose price is less than 60.
import numpy as np
dataframe = pd.read_excel('C:/Users/DELL/Desktop/foodsalesdata.xlsx', index_col=0)
pivot_tble=pd.pivot_table(dataframe, index='Product', values='UnitPrice', aggfunc='sum')
low_price=pivot_tble[pivot_tble['UnitPrice'] < 60]
print(low_price)

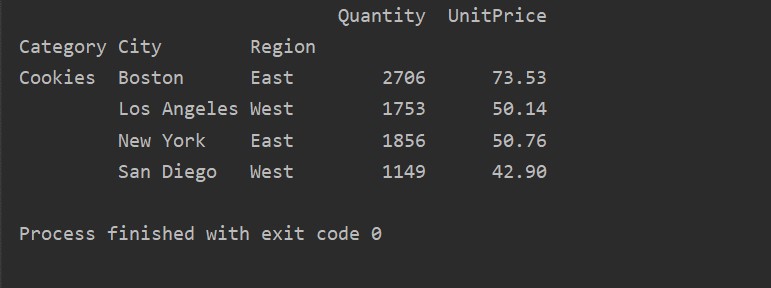
By using another query method, you can filter results. For example, For example, we have filtered the cookies category based on the following features:
import numpy as np
dataframe = pd.read_excel('C:/Users/DELL/Desktop/foodsalesdata.xlsx', index_col=0)
pivot_tble=pd.pivot_table(dataframe,index=["Category","City","Region"],values=["UnitPrice", "Quantity"],aggfunc=np.sum)
pt=pivot_tble.query('Category == ["Cookies"]')
print(pt)
Output:
Visualize the Pivot Table Data
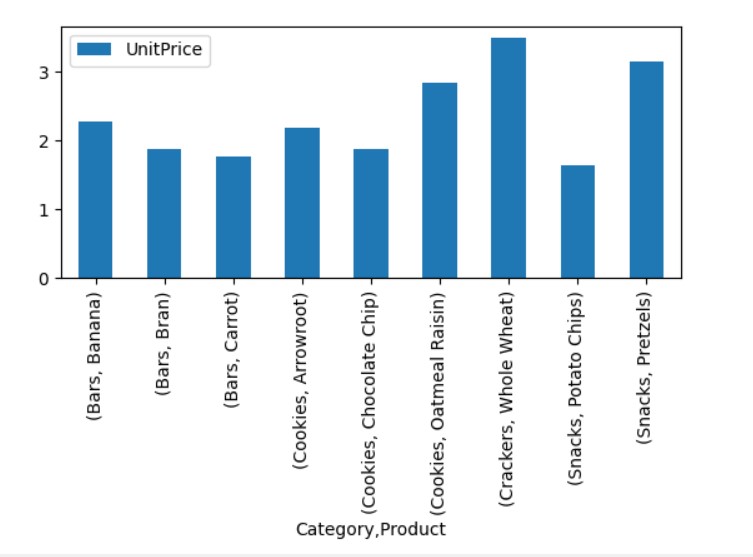
To visualize the pivot table data, follow the following method:
import numpy as np
import matplotlib.pyplot as plt
dataframe = pd.read_excel('C:/Users/DELL/Desktop/foodsalesdata.xlsx', index_col=0)
pivot_tble=pd.pivot_table(dataframe,index=["Category","Product"],values=["UnitPrice"])
pivot_tble.plot(kind='bar');
plt.show()
In the above visualization, we have shown the unit price of the different products along with categories.
Conclusion
We explored how you can generate a pivot table from the dataframe using Pandas python. A pivot table allows you to generate deep insights into your data sets. We have seen how to generate a simple pivot table using multi-index and apply the filters on pivot tables. Moreover, we have also shown to plot pivot table data and fill missing data.
from Linux Hint https://ift.tt/3cvbpTQ


0 Comments