This article will demonstrate how to install and configure Prometheus in Ubuntu 20.04 LTS (Focal Fossa) systems. The article will also explain how to add an exporter to Prometheus to expand its usefulness.
Note: The procedure and commands in this article were performed using Ubuntu 20.04 LTS (Focal Fossa).
Prerequisites
Before installing Prometheus, be sure to complete the following perquisites.
1. Install Nginx
Follow the steps below to install Nginx:
Use the following command in Terminal to update the system repository index
Next, enter the following command to install Nginx:
Once Nginx is installed, use the following commands to confirm that the Nginx service is running:
If the Nginx service is not running, you can start the service by entering the following command:
2. Create Prometheus Users
Enter the following to create Prometheus user accounts to be used as a service user accounts for security and administration purposes. These accounts will not be used for logging into the system. Use the following commands in Terminal to create the service user accounts.
$ sudo useradd --no-create-home --shell /bin/false node_exporter
3. Create Prometheus Directories
Enter the following to create some directories that will be used to store files and data:
$ sudo mkdir /var/lib/prometheus
Downloading and Installing Prometheus
Once all these prerequisites are completed, your system will be ready to install Prometheus. Below is the procedure for downloading and installing Prometheus.
Download the latest stable release of Prometheus using the wget command.
prometheus-2.0.0.linux-amd64.tar.gz
Extract the Prometheus archive using the following command:
From the extracted folder, copy the binary files to the /usr/local/bin directory and change the ownership.
Use the following commands to copy the “prometheus” and “promtool” binary files to the /usr/local/bin.
$ sudo cp prometheus-2.0.0.linux-amd64/promtool /usr/local/bin/
Next, change the ownership of the files by entering the commands below.
$ sudo chown prome:prome /usr/local/bin/promtool
After copying the binary files, copy the required libraries to the /etc/prometheus directory. Use the following commands in Terminal to do so:
$ sudo cp -r prometheus-2.0.0.linux-amd64/console_libraries /etc/prometheus
Then, use the following commands to change the ownership of the files.
$ sudo chown -R prome:prome /etc/prometheus/console_libraries
Prometheus Configuration
In this section, we will create the configuration file named prometheus.yml in the /etc/prometheus directory created in the previous steps. Issue the following command in Terminal to edit the prometheus.yml file:
Next, copy and paste the following lines into the terminal:
scrape_interval: 15s
scrape_configs:
- job_name: 'prometheus'
scrape_interval: 5s
static_configs:
- targets: ['localhost:9090']
Hit Ctrl+o to save and Ctrl+x to exit the file.
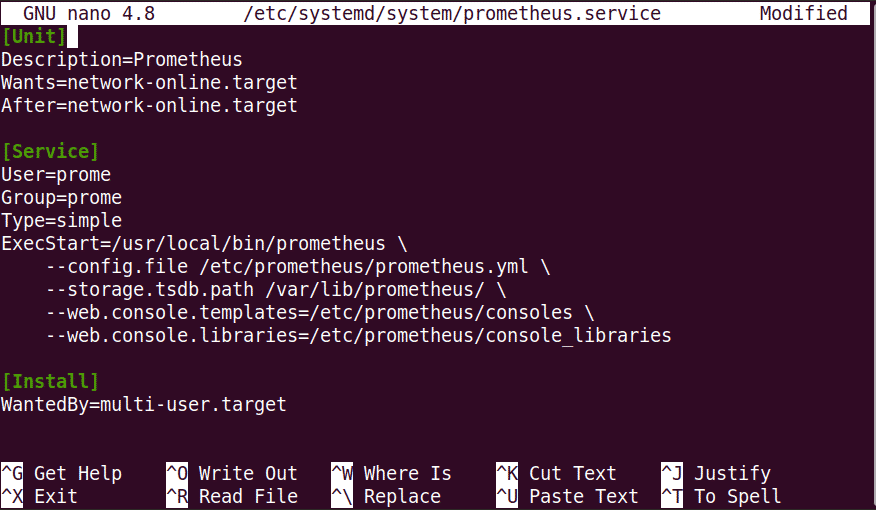
Now, we will create another file for the systemd service. Issue the following command in the Terminal to do so:
Next, copy and paste the following lines into the terminal:
Description=Prometheus
Wants=network-online.target
After=network-online.target
[Service]
User=prome
Group=prome
Type=simple
ExecStart=/usr/local/bin/prometheus \
--config.file /etc/prometheus/prometheus.yml \
--storage.tsdb.path /var/lib/prometheus/ \
--web.console.templates=/etc/prometheus/consoles \
--web.console.libraries=/etc/prometheus/console_libraries
[Install]
WantedBy=multi-user.target
Hit Ctrl+o to save the file and Ctrl+x to exit the file.
Once you are done with the above configurations, reload systemd using the following command:
Start the Prometheus service by issuing the following command:
To enable the Prometheus service at system boot, use the following command:
After starting the Prometheus service, use the following command to view the service status:
The following screenshot shows that the Prometheus service is active and running.
Access the Prometheus Web Interface
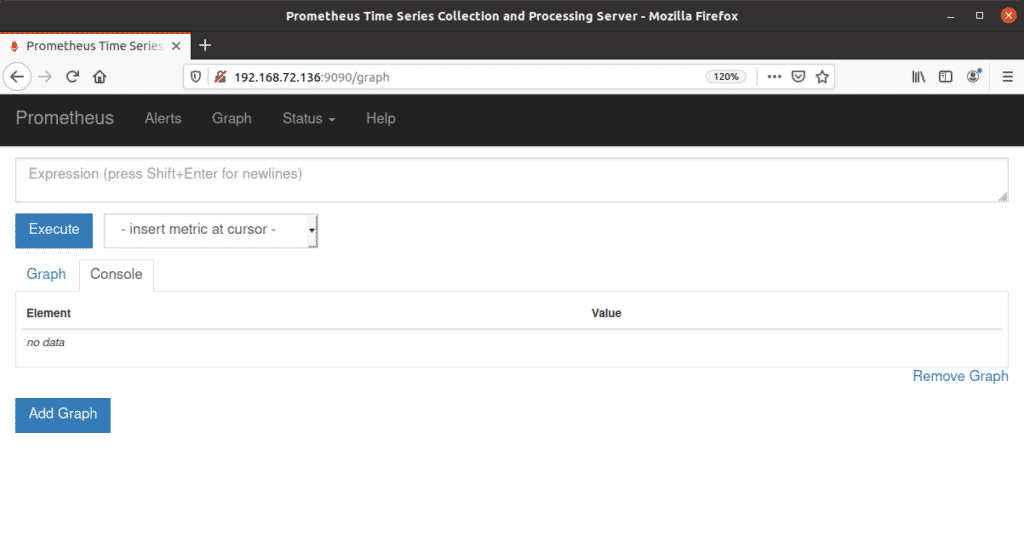
Next, try accessing the Prometheus web interface. Open a web browser and navigate to the following address:
Replace the term “ip-address” with the actual IP address of your system. You can access the Prometheus web interface from any system within your local network. You can also use localhost or 127.0.0.1 to access the Prometheus site on your local system. However, in this case, you would not be able to access it from any other system on the network.
At this stage, Prometheus only shows metrics about itself, which might not be of much use. The next section will show you how to expand the utility of Prometheus by adding exporters.
Add Exporters
To make Prometheus more useful to you, try adding exporters. Some of the most commonly used exporters include the following:
- Node_exporter-
- Blackbox_exporter
- rabbitmq_exporter
- Mysqld_exporter
Here, we will add node_exporter to the Prometheus system. Node_exporter generates metrics about resources like CPU, memory, disk usage, etc.
First, download the node_exporter to your system with the following command:
v0.15.1/node_exporter-0.15.1.linux-amd64.tar.gz
Extract the archive using the following command:
sudo nano /etc/prometheus/prometheus.yml
From the extracted folder, copy the binaries files to the /usr/local/bin directory and change the ownership. Issue the following command to copy the node_exporter binary files to the /usr/local/bin directory.
Set the ownership of the directory with the following command:
Create a service file for the exporter using the following command:
Next, copy and paste the following lines into the terminal:
Description=Prometheus
Wants=network-online.target
After=network-online.target
[Service]
User= node_exporter
Group= node_exporter
Type=simple
ExecStart=/usr/local/bin/prometheus \
--config.file /etc/prometheus/prometheus.yml \
--storage.tsdb.path /var/lib/prometheus/ \
--web.console.templates=/etc/prometheus/consoles \
--web.console.libraries=/etc/prometheus/console_libraries
[Install]
WantedBy=multi-user.target
Hit Ctrl+o to save and Ctrl+x to exit the file.
Reload the systemd using the following command:
Issue the following command to start the node_exporter service:
To enable the node_exporter service at boot, enter the following command:
Configuring Prometheus for node_exporter
In this section, we will configure Prometheus to scrape node_exporter. Run the following command in Terminal to edit the configuration file:
Copy and paste the following lines into the terminal:
scrape_interval: 5s
static_configs:
- targets: ['localhost:9100']
Hit Ctrl+o to save and Ctrl+x to exit the file. Restart the Prometheus service using the following command:
You can verify the status of the Prometheus service to confirm that it is running properly by entering the following command:$ sudo systemctl status prometheus Try accessing Prometheus by opening any web browser and navigating to the following address:
When the web interface opens, use the drop-down arrow to select any metric and click the Execute button to view a graph.
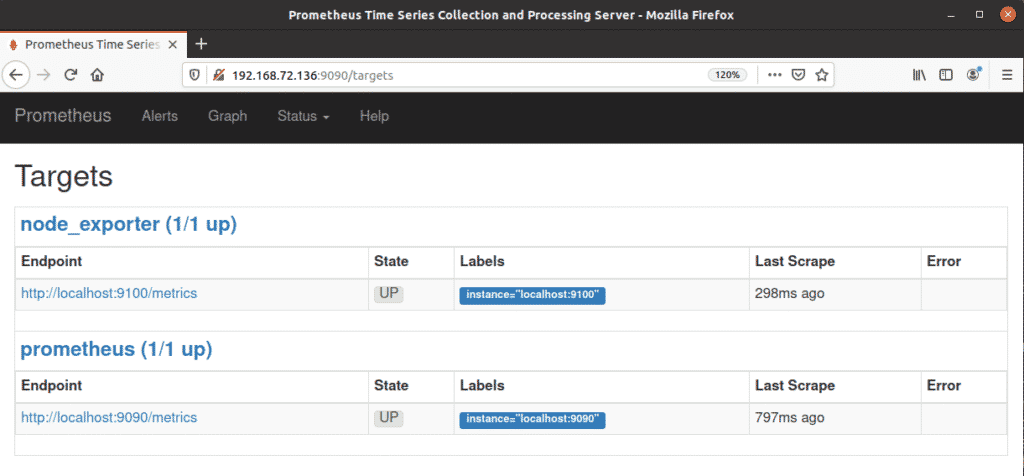
 If you go to Status > Target from the menu at the top of the page, you will see both Prometheus and node_exporter listed there, as we have configured Prometheus to scrape both itself and the node_exporter.
Conclusion
That is all there is to it! In this article, you have learned how to install Prometheus in Ubuntu 20.04 LTS (Focal Fossa), as well as how to use the node exporter in Prometheus. I hope that after reading this article, you are now comfortable enough to install Prometheus and an exporter to generate metrics about your server’s resources.
from Linux Hint https://ift.tt/3fQ9usq


0 Comments